5. Events and logging
This section describes how to monitor and configure logging using the CLI, GUI, REST, IPMI and Redfish interfaces.
5.1. BMC command line
The standard Linux journal is available with the journalctl command on the BMC.
5.2. GUI
The logging operations available via the GUI are described in Table 5.1. The GUI page for viewing event logs is shown in Fig. 5.1.
Command |
Description |
|---|---|
Event log |
Display event logs. |
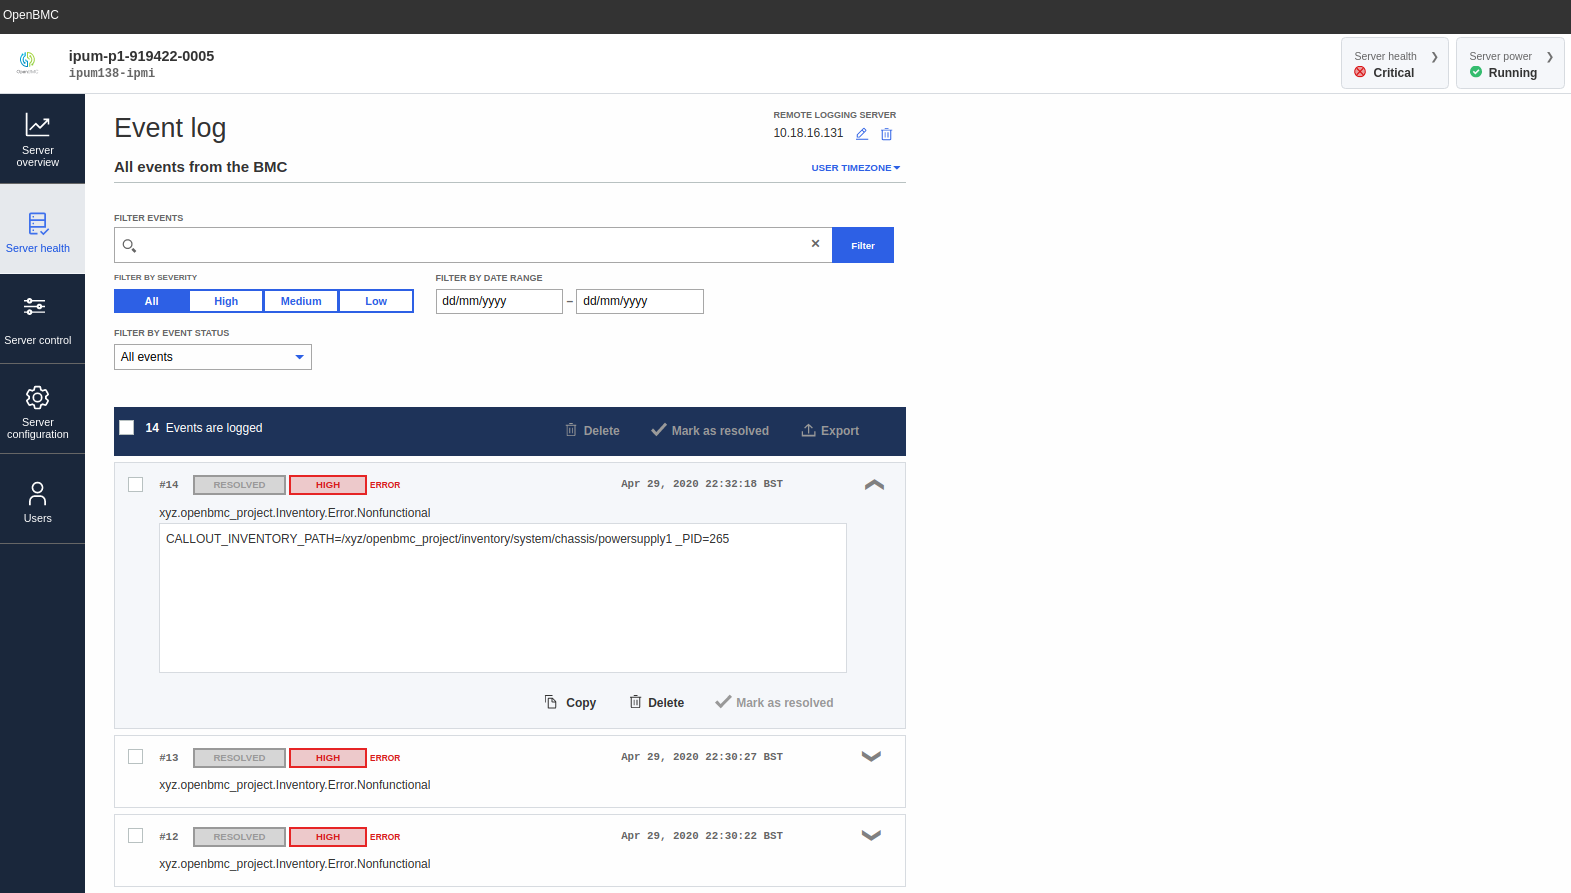
Fig. 5.1 GUI event logging operations
5.3. REST API
You can perform logging operations through the REST API either by sending
curl queries to the URI or by using the Graphcore openbmctool.py utility.
Table 5.2 describes the commands available.
Command |
Description |
|---|---|
|
List log entries (all types), log managers and log configurations available on the system. |
List all logs: $ curl -k https://<bmcip>/xyz/openbmc_project/logging/list -u <bmcuser>:<bmcpass>
|
|
|
Show detailed information about log entries (all types), log managers and log configurations available on the system. |
Enumerate logs: $ curl -k https://<bmcip>/xyz/openbmc_project/logging/enumerate -u <bmcuser>:<bmcpass>
|
|
|
Resolve a SEL |
$ curl -k -H "Content-Type: application/json" -d '{"data":true}' -X PUT https://<bmcip>/xyz/openbmc_project/logging/entry/<eventId>/attr/Resolved -u <bmcuser>:<bmcpass>
|
|
Configuration |
Configure syslog logging on the BMC. |
Configure syslog server address and port: $ curl -k -H "Content-Type: application/json" -X PUT -d '{"data":<port>}' https://<bmcuser>:<bmcpass>@<bmcip>/xyz/openbmc_project/logging/config/remote/attr/Port
$ curl -k -H "Content-Type: application/json" -X PUT -d '{"data":"<address>"}' https://<bmcuser>:<bmcpass>@<bmcip>/xyz/openbmc_project/logging/config/remote/attr/Address
$ python3 openbmctool.py -H <bmcip> -U <bmcuser> -P <bmcpass> logging remote_logging_config -a ADDRESS -p PORT
View syslog configuration: $ python3 openbmctool.py -H <bmcip> -U <bmcuser> -P <bmcpass> logging remote_logging view
Disable syslog: $ python3 openbmctool.py -H <bmcip> -U <bmcuser> -P <bmcpass> logging remote_logging disable
|
|
Example of listing log entries, log managers and logging configuration:
$ curl -k https://<bmcip>/xyz/openbmc_project/logging/list -u <bmcuser>:<bmcpass>
{
  "data": [
    "/xyz/openbmc_project/logging/config",
    "/xyz/openbmc_project/logging/config/remote",
    "/xyz/openbmc_project/logging/entry",
    "/xyz/openbmc_project/logging/entry/15",
    "/xyz/openbmc_project/logging/entry/16",
    "/xyz/openbmc_project/logging/entry/17",
    "/xyz/openbmc_project/logging/entry/18",
    "/xyz/openbmc_project/logging/entry/19",
    "/xyz/openbmc_project/logging/entry/20",
    "/xyz/openbmc_project/logging/entry/21",
    "/xyz/openbmc_project/logging/entry/21/callout",
    "/xyz/openbmc_project/logging/internal",
    "/xyz/openbmc_project/logging/internal/manager",
    "/xyz/openbmc_project/logging/rest_api_logs"
  ],
  "message": "200 OK",
  "status": "ok"
}
5.4. IPMI
You can read all the events for the IPU-M2000 using the IPMI commands shown in Table 5.3.
Command |
Description |
|---|---|
SEL clear |
Clear all event logs |
ipmitool -I lanplus -C 3 -p 623 -U <bmcuser> -P <bmcpass> -H <bmcip> sel clear
|
|
SEL list |
Display list of events |
ipmitool -I lanplus -C 3 -p 623 -U <bmcuser> -P <bmcpass> -H <bmcip> sel list
|
|
SEL elist |
Displays extended info list of events |
ipmitool -I lanplus -C 3 -p 623 -U <bmcuser> -P <bmcpass> -H <bmcip> sel elist
|
|
Some examples of SEL entries for sensors going over their threshold, or errors with inventory items (such as not present or not functional) are shown below.
When the inlet sensor goes above 45°C or the exhaust temperature sensor goes above 75°C, two generic system hardware failure events are logged as shown below.
$ ipmitool -I lanplus -C 3 -p 623 -U <bmcuser> -P <bmcpass> -H <bmcip> sel elist
XX | 05/11/2020 | 08:06:21 AM CEST | System Event #0x90 | Undetermined system hardware failure | Asserted
XX | 05/11/2020 | 08:06:24 AM CEST | System Event #0x90 | Undetermined system hardware failure | Asserted
Note
Event logging for sensors is not limited to inlet and exhaust sensors (it is available for all sensors). However, only these two sensors will cause a system shutdown.
All sensor related events are logged as generic hardware failures. You will need to cross check the SDR to specific sensor fault.
In addition, if you have configured an SNMP manager (see SNMP trap) for receiving SNMP event traps, you can see the following traps associated with the SEL entries. You can use these to identify the faulty sensor (in this case, the inlet sensor going over 45°C).
2020-05-11 08:06:24 <bmc_fqdomain> [UDP: [<bmcip>]:<port>->[<snmpmgrip>]:<dport>]:
iso.3.6.1.6.3.1.1.4.1.0 = OID: iso.3.6.1.4.1.49871.1.0.0.1      iso.3.6.1.4.1.49871.1.0.1.1 = Gauge32: 47   iso.3.6.1.4.1.49871.1.0.1.2 = Opaque: UInt64: 168713071370436978 iso.3.6.1.4.1.49871.1.0.1.3 = INTEGER: 3    iso.3.6.1.4.1.49871.1.0.1.4 = STRING: "xyz.openbmc_project.Sensor.Threshold.Error.CriticalHigh - SENSOR_DATA=|/xyz/openbmc_project/sensors/temperature/inlet:Value=45000|"

2020-05-11 08:06:24 <bmc_fqdomain> [UDP: [<bmcip>]:60408->[<snmpmgrip>]:<dport>]:
iso.3.6.1.6.3.1.1.4.1.0 = OID: iso.3.6.1.4.1.49871.1.0.0.1      iso.3.6.1.4.1.49871.1.0.1.1 = Gauge32: 48   iso.3.6.1.4.1.49871.1.0.1.2 = Opaque: UInt64: 168728099461005682 iso.3.6.1.4.1.49871.1.0.1.3 = INTEGER: 3    iso.3.6.1.4.1.49871.1.0.1.4 = STRING: "xyz.openbmc_project.State.Shutdown.ThermalEvent.Error.Ambient - _PID=265"
When a power supply failure or removal is detected, the following SEL entry can be observed:
$ ipmitool -I lanplus -C 3 -p 623 -U <bmcuser> -P <bmcpass> -H <bmcip> sel elist
XX | 05/11/2020 | 08:39:53 AM CEST | Power Supply #0x0a | Presence detected | Asserted
You need to cross check with the SDR to identify if this is a failure or absence of the power supply.
In the case of a functional error, the following output will be seen:
powersupply1 | 0Ah | ok | 10.2 | Presence Detected, Failure detectedIn the case of a presence error, the following output will be seen:
powersupply1 | 0Ah | ok | 10.2 |
For this power supply SEL entry, the following trap is received on the SNMP manager.
2020-05-12 13:38:14 <bmc_fqdomain> [UDP: [<bmcip>]:<sport>->[<snmpgrip>]:<dport>]:
iso.3.6.1.6.3.1.1.4.1.0 = OID: iso.3.6.1.4.1.49871.1.0.0.1      iso.3.6.1.4.1.49871.1.0.1.1 = Gauge32: 52       iso.3.6.1.4.1.49871.1.0.1.2 = Opaque: UInt64: 625323637452308850       iso.3.6.1.4.1.49871.1.0.1.3 = INTEGER: 3        iso.3.6.1.4.1.49871.1.0.1.4 = STRING: "xyz.openbmc_project.Inventory.Error.Nonfunctional - CALLOUT_INVENTORY_PATH=/xyz/openbmc_project/inventory/system/chassis/powersupply1"
When an IPU failure is detected, the following SEL entry will be seen:
$ ipmitool -I lanplus -C 3 -p 623 -U <bmcuser> -P <bmcpass> -H <bmcip> sel elist
XX | 05/12/2020 | 04:13:22 PM CEST | Processor #0x11 | Disabled | Asserted
You need to cross check with the SDR to identify if it is a functional or presence error.
In the case of a functional error, the following output will be seen:
ipu0 | 11h | ok | 45.1 | Presence detected, DisabledIn the case of a presence error, the following output will be seen:
ipu0 | 11h | ok | 45.1 |
Note
RNICs are also defined as processor/IO modules and similar SEL/SDR entries will appear in the case of an RNIC failure.
For the above IPU SEL entry, a trap similar to that shown below will be received by the configured SNMP manager.
2020-05-12 22:53:45 ipum.example.com [UDP: [<bmcip>]:<sport>->[<snmpmgrip>]:<dport>]:
iso.3.6.1.6.3.1.1.4.1.0 = OID: iso.3.6.1.4.1.49871.1.0.0.1      iso.3.6.1.4.1.49871.1.0.1.1 = Gauge32: 63    iso.3.6.1.4.1.49871.1.0.1.2 = Opaque: UInt64: 768481056411091314        iso.3.6.1.4.1.49871.1.0.1.3 = INTEGER: 3     iso.3.6.1.4.1.49871.1.0.1.4 = STRING: "xyz.openbmc_project.Inventory.Error.Nonfunctional - CALLOUT_INVENTORY_PATH=/xyz/openbmc_project/inventory/system/chassis/motherboard/ipu0"
When an NVME failure is detected, an SEL entry like the following will be logged:
XX | 05/13/2020 | 10:18:37 AM CEST | Drive Slot / Bay #0x42 | Drive Fault | AssertedA cross check with SDR is needed to figure out if it is a functional or presence error.
In the case of a functional error:
nvme0 | 42h | ok | 4.1 | Drive Present, Drive FaultIn the case of a presence error:
nvme0 | 42h | ok | 4.1 |
For the above NVMe SEL entry, a trap like the following is received on the SNMP manager:
2020-05-13 10:18:37 ipum.example.com [UDP: [<bmcip>]:<sport>->[snmpmgrip]:<dport>]:
iso.3.6.1.6.3.1.1.4.1.0 = OID: iso.3.6.1.4.1.49871.1.0.0.1      iso.3.6.1.4.1.49871.1.0.1.1 = Gauge32: 71       iso.3.6.1.4.1.49871.1.0.1.2 = Opaque: UInt64: 944969603430220146        iso.3.6.1.4.1.49871.1.0.1.3 = INTEGER: 3        iso.3.6.1.4.1.49871.1.0.1.4 = STRING: "xyz.openbmc_project.Inventory.Error.Nonfunctional - CALLOUT_INVENTORY_PATH=/xyz/openbmc_project/inventory/system/chassis/motherboard/nvme0"
When an event is de-asserted, a generic system entry with
Deassertedstate is recorded in the SEL as shown below:05/13/2020 | 08:24:21 AM CEST | System Event #0x90 | Undetermined system hardware failure | Deasserted
5.5. Redfish
You can do logging operations through Redfish interface either by sending curl queries or browsing the URI.
SEL endpoints can be found in the Systems collection available at https://<bmcip>/redfish/v1/Systems/system/LogServices/.
Journal endpoints can be found in the Manager collection available at https://<bmcip>/redfish/v1/Managers/bmc/LogServices.
Command |
Description |
|---|---|
List SEL |
List SEL entries. |
$ curl -k https://<bmcip>/redfish/v1/Systems/system/LogServices/EventLog/Entries -u <bmcuser>:<bmcpass>
|
|
Delete logging entries |
Delete system event entries. |
$ curl -k https://<bmcip>/redfish/v1/Systems/system/LogServices/EventLog/Actions/LogService.ClearLog -u <bmcuser>:<bmcpass>
|
|
List journal logs |
List systemd journal logs through Redfish. |
$ curl -k https://<bmcip>/redfish/v1/Managers/bmc/LogServices/Journal/Entries -u <bmcuser>:<bmcpass>
|
|
Note
Redfish SELs do not include the inventory item that created the log.
Example output from the list SEL command is shown below:
$ curl -k https://<bmcip>/redfish/v1/Systems/system/LogServices/EventLog/Entries -u <bmcuser>:<bmcpass>
{
      "@odata.context": "/redfish/v1/$metadata#LogEntryCollection.LogEntryCollection",
      "@odata.id": "/redfish/v1/Systems/system/LogServices/EventLog/Entries",
      "@odata.type": "#LogEntryCollection.LogEntryCollection",
      "Description": "Collection of System Event Log Entries",
      "Members": [
        {
          "@odata.context": "/redfish/v1/$metadata#LogEntry.LogEntry",
          "@odata.id": "/redfish/v1/Systems/system/LogServices/EventLog/Entries/15",
          "@odata.type": "#LogEntry.v1_4_0.LogEntry",
          "Created": "2020-05-11T11:45:21+00:00",
          "EntryType": "Event",
          "Id": "15",
          "Message": "xyz.openbmc_project.Inventory.Error.Nonfunctional",
          "Name": "System Event Log Entry",
          "Severity": "Critical"
        },
        {
          "@odata.context": "/redfish/v1/$metadata#LogEntry.LogEntry",
          "@odata.id": "/redfish/v1/Systems/system/LogServices/EventLog/Entries/16",
          "@odata.type": "#LogEntry.v1_4_0.LogEntry",
          "Created": "2020-05-11T11:45:23+00:00",
          "EntryType": "Event",
          "Id": "16",
          "Message": "xyz.openbmc_project.Inventory.Error.Nonfunctional",
          "Name": "System Event Log Entry",
          "Severity": "Critical"
        },
      ],
      "Members@odata.count": 2,
      "Name": "System Event Log Entries"
}
Example output from the command to list journal entries is shown below:
$ curl -k https://<bmcip>/redfish/v1/Managers/bmc/LogServices/Journal/Entries -u <bmcuser>:<bmcpass>
{
   "@odata.context": "/redfish/v1/$metadata#LogEntryCollection.LogEntryCollection",
   "@odata.id": "/redfish/v1/Managers/bmc/LogServices/BmcLog/Entries",
   "@odata.type": "#LogEntryCollection.LogEntryCollection",
   "Description": "Collection of BMC Journal Entries",
   "Members": [
     {
       "@odata.context": "/redfish/v1/$metadata#LogEntry.LogEntry",
       "@odata.id": "/redfish/v1/Managers/bmc/LogServices/Journal/Entries/1589216068566513",
       "@odata.type": "#LogEntry.v1_4_0.LogEntry",
       "Created": "2020-05-11T16:54:28+00:00",
       "EntryType": "Oem",
       "Id": "1589216068566513",
       "Message": "Booting Linux on physical CPU 0x0",
       "Name": "BMC Journal Entry",
       "OemRecordFormat": "BMC Journal Entry",
       "Severity": "OK"
     },
     ....
   ],
   "Members@odata.count": 2096,
   "Members@odata.nextLink": "/redfish/v1/Managers/bmc/LogServices/Journal/Entries?$skip=1000",
   "Name": "Open BMC Journal Entries"
 }
5.6. List of supported events
5.6.1. Sensor crossing threshold events
For the sensors that support event logging, a single “Undetermind system hardware failure” is logged in “Asserted” state.
$ ipmitool -I lanplus  -U <bmcuser> -P <bmcpass> -H <bmcip> sel elist
  1a | 06/20/2021 | 07:41:04 | System Event #0x90 | Undetermined system hardware failure | Asserted
For the sensors that support event logging and shutdown action, two consecutive “Undetermined system hardware failure” message are logged in Asserted state.
$ ipmitool -I lanplus  -U <bmcuser> -P <bmcpass> -H <bmcip> sel elist
1a | 06/20/2021 | 07:41:04 | System Event #0x90 | Undetermined system hardware failure | Asserted
1b | 06/20/2021 | 07:41:06 | System Event #0x90 | Undetermined system hardware failure | Asserted
Note
Please see Section 3, Sensor monitoring for the list of monitored sensors and event/actions associated with them.
Sensor crossing threshold events are not resolved automatically and need to be set to resolved manually
as described in previous sections. The :code: sel elist command reports as below when those events are resolved.
$ ipmitool -I lanplus  -U <bmcuser> -P <bmcpass> -H <bmcip> sel elistc
  1a | 06/20/2021 | 07:41:04 | System Event #0x90 | Undetermined system hardware failure | Deasserted
  1b | 06/20/2021 | 07:41:06 | System Event #0x90 | Undetermined system hardware failure | Deasserted
For more detailed description of sensor related events, the Redfish, GUI or REST interfaces should be used, which contains detailed information including the sensor name and the value of the sensor when the threshold was crossed.
$ curl -k https://<bmcip>/redfish/v1/Systems/system/LogServices/EventLog/Entries -u <bmcuser>:<bmcpass>
{
  "@odata.context": "/redfish/v1/$metadata#LogEntryCollection.LogEntryCollection",
  "@odata.id": "/redfish/v1/Systems/system/LogServices/EventLog/Entries",
  "@odata.type": "#LogEntryCollection.LogEntryCollection",
  "Description": "Collection of System Event Log Entries",
  "Members": [
    {
      "@odata.context": "/redfish/v1/$metadata#LogEntry.LogEntry",
      "@odata.id": "/redfish/v1/Systems/system/LogServices/EventLog/Entries/26",
      "@odata.type": "#LogEntry.v1_4_0.LogEntry",
      "Created": "2021-06-20T07:41:04+00:00",
      "EntryType": "Event",
      "Id": "26",
      "Message": "xyz.openbmc_project.Sensor.Threshold.Error.CriticalHigh",
      "Name": "System Event Log Entry",
      "Severity": "Critical"
    },
    {
      "@odata.context": "/redfish/v1/$metadata#LogEntry.LogEntry",
      "@odata.id": "/redfish/v1/Systems/system/LogServices/EventLog/Entries/27",
      "@odata.type": "#LogEntry.v1_4_0.LogEntry",
      "Created": "2021-06-20T07:41:06+00:00",
      "EntryType": "Event",
      "Id": "27",
      "Message": "xyz.openbmc_project.State.Shutdown.ThermalEvent.Error.Ambient",
      "Name": "System Event Log Entry",
      "Severity": "Critical"
    }
  ],
  "Members@odata.count": 2,
  "Name": "System Event Log Entries"
}
Note
GUI, REST and Redfish interfaces represent sensor crossing threshold events with “xyz.openbmc_project.Sensor.Threshold.Error.CriticalHigh” or “xyz.openbmc_project.Sensor.Threshold.Error.WarningHigh” events with the sensor name as meta data. If the event is a shutdown event, it gets logged with “xyz.openbmc_project.State.Shutdown.ThermalEvent.Error.Ambient” message in the event logs.
5.6.2. Inventory items present state or functional state events
Present and functional state of the following inventory items are tracked.
PSU0 and PSU1
FAN0 to FAN4
IPU0 to IPU3
RNIC0 and RNIC1
NVMe0
Note
For the inventory items listed under number 3 to 5, the functional state is currently determined by checking the state of PCIe link of the endpoint to be up as Gen4x8 links.
Below are examples of SEL logs when power supply present or functional state changes.
# Powersupply0 not present
$ ipmitool -I lanplus  -U <bmcuser> -P <bmcpass> -H <bmcip> sel elist
   1c | 06/20/2021 | 13:22:58 | Power Supply #0x09 | Presence detected | Asserted
$ ipmitool -I lanplus  -U <bmcuser> -P <bmcpass> -H <bmcip> sdr elist | grep powersupply
   powersupply0     | 09h | ok  | 10.1 |
   powersupply1     | 0Ah | ok  | 10.2 |  Presence detected

# Powersupply1 not present
$ ipmitool -I lanplus  -U <bmcuser> -P <bmcpass> -H <bmcip> sel elist
   1d | 06/20/2021 | 13:41:52 | Power Supply #0x0a | Presence detected | Asserted
$ ipmitool -I lanplus  -U <bmcuser> -P <bmcpass> -H <bmcip> sdr elist | grep powersupply
   powersupply0     | 09h | ok  | 10.1 |  Presence detected
   powersupply1     | 0Ah | ok  | 10.2 |

# Powersupply0 back to present or functional
$ ipmitool -I lanplus  -U <bmcuser> -P <bmcpass> -H <bmcip> sel elist
   1c | 06/20/2021 | 13:22:58 | System Event #0x90 | Undetermined system hardware failure | Deasserted
# Powersupply1 back to present
$ ipmitool -I lanplus  -U <bmcuser> -P <bmcpass> -H <bmcip> sel elist
   1d | 06/20/2021 | 13:22:58 | System Event #0x90 | Undetermined system hardware failure | Deasserted

# Powersupply0 not functional
$ ipmitool -I lanplus  -U <bmcuser> -P <bmcpass> -H <bmcip> sel elist
   20 | 06/20/2021 | 14:40:41 | Power Supply #0x09 | Presence detected | Asserted
$ ipmitool -I lanplus  -U <bmcuser> -P <bmcpass> -H <bmcip> sdr elist | grep powersupply
  powersupply0     | 09h | ok  | 10.1 | Presence detected, Failure detected
  powersupply1     | 0Ah | ok  | 10.2 | Presence detected

# Powersupply1 not functional
$ ipmitool -I lanplus  -U <bmcuser> -P <bmcpass> -H <bmcip> sel elist
   21 | 06/20/2021 | 14:40:41 | Power Supply #0x09 | Presence detected | Asserted
$ ipmitool -I lanplus  -U <bmcuser> -P <bmcpass> -H <bmcip> sdr elist | grep powersupply
  powersupply0     | 09h | ok  | 10.1 | Presence detected
  powersupply1     | 0Ah | ok  | 10.2 | Presence detected, Failure detected
Below are examples of SEL logs when fan modules present or functional state changes.
# Fan module 0 not present
$ ipmitool -I lanplus  -U <bmcuser> -P <bmcpass> -H <bmcip> sel elist
  22 | 06/20/2021 | 14:49:41 | Fan #0x3c | State Deasserted | Asserted
$ ipmitool -I lanplus  -U <bmcuser> -P <bmcpass> -H <bmcip> sdr elist | grep fan
  fan0             | 3Ch | ok  | 29.11 |
  fan1             | 3Dh | ok  | 29.12 | State Deasserted
  fan2             | 3Eh | ok  | 29.13 | State Deasserted
  fan3             | 3Fh | ok  | 29.14 | State Deasserted
  fan4             | 40h | ok  | 29.15 | State Deasserted

# Fan module 0 not functional
$ ipmitool -I lanplus  -U <bmcuser> -P <bmcpass> -H <bmcip> sel elist
  22 | 06/20/2021 | 14:49:41 | Fan #0x3c | State Deasserted | Asserted

# Fan module present or functional state back to ok
$ ipmitool -I lanplus  -U <bmcuser> -P <bmcpass> -H <bmcip> sel elist
  22 | 06/20/2021 | 14:59:08 | System Event #0x90 | Undetermined system hardware failure | Deasserted
Below are examples of SEL logs when the ipu0 inventory item is not detected as PCIe endpoint or their functional state changes.
# IPU 0 is not detected as present
$ ipmitool -I lanplus  -U <bmcuser> -P <bmcpass> -H <bmcip> sel elist
  23 | 06/20/2021 | 15:06:03 | Processor #0x11 | Disabled | Asserted
$ ipmitool -I lanplus  -U <bmcuser> -P <bmcpass> -H <bmcip> sdr elist | grep ipu
  ipu0             | 11h | ok  | 45.1 |
  ipu1             | 12h | ok  | 45.2 | Presence detected
  ipu2             | 13h | ok  | 45.3 | Presence detected
  ipu3             | 14h | ok  | 45.4 | Presence detected

# IPU 0 is not detected as functional
$ ipmitool -I lanplus  -U <bmcuser> -P <bmcpass> -H <bmcip> sel elist
24 | 06/20/2021 | 15:12:36 | Processor #0x11 | Disabled | Asserted
$ ipmitool -I lanplus  -U <bmcuser> -P <bmcpass> -H <bmcip> sdr elist | grep ipu
  ipu0             | 11h | ok  | 45.1 | Presence detected, Disabled
  ipu1             | 12h | ok  | 45.2 | Presence detected
  ipu2             | 13h | ok  | 45.3 | Presence detected
  ipu3             | 14h | ok  | 45.4 | Presence detected
Below are example of SEL logs when the rnic0 inventory item is not detected as a PCIe endpoint or its functional state changes.
# RNIC 0 is not detected as prenset
$ ipmitool -I lanplus  -U <bmcuser> -P <bmcpass> -H <bmcip> sel elist
25 | 06/20/2021 | 16:01:01 | Processor #0x17 | Disabled | Asserted
$ ipmitool -I lanplus  -U <bmcuser> -P <bmcpass> -H <bmcip> sdr elist | grep rnic
rnic0            | 17h | ok  | 45.7 |
rnic1            | 18h | ok  | 45.8 | Presence detected

# RNIC 0 is not detected as functional
$ ipmitool -I lanplus  -U <bmcuser> -P <bmcpass> -H <bmcip> sel elist
26 | 06/20/2021 | 16:05:13 | Processor #0x17 | Disabled | Asserted
$ ipmitool -I lanplus  -U <bmcuser> -P <bmcpass> -H <bmcip> sdr elist | grep rnic
rnic0            | 17h | ok  | 45.7 | Presence detected, Disabled
rnic1            | 18h | ok  | 45.8 | Presence detected
Below are examples of SEL logs when the nvme0 inventory item is not detected as a PCIe endpoint or its functional state changes.
# NVMe drive is detected as not present
$ ipmitool -I lanplus  -U <bmcuser> -P <bmcpass> -H <bmcip> sel elist
27 | 06/20/2021 | 16:07:57 | Drive Slot / Bay #0x42 | Drive Fault | Asserted
$ ipmitool -I lanplus  -U <bmcuser> -P <bmcpass> -H <bmcip> sdr elist | grep nvme
nvme0            | 42h | ok  |  4.1 |

# NVMe drive is detected as not functional
$ ipmitool -I lanplus  -U <bmcuser> -P <bmcpass> -H <bmcip> sel elist
28 | 06/20/2021 | 16:10:27 | Drive Slot / Bay #0x42 | Drive Fault | Asserted
$ ipmitool -I lanplus  -U <bmcuser> -P <bmcpass> -H <bmcip> sdr elist | grep nvme
nvme0            | 42h | ok  |  4.1 | Drive Present, Drive Fault

# When preset state error or functional state error is resolved.
$ ipmitool -I lanplus  -U <bmcuser> -P <bmcpass> -H <bmcip> sel elist
27 | 06/20/2021 | 16:07:57 | System Event #0x90 | Undetermined system hardware failure | Deasserted
$ ipmitool -I lanplus  -U <bmcuser> -P <bmcpass> -H <bmcip> sdr elist | grep nvme
nvme0            | 42h | ok  |  4.1 | Drive Present
GUI, REST and Redfish represent inventory present or functional error events with “xyz.openbmc_project.Inventory.Error.NonPresent” or “xyz.openbmc_project.Inventory.Error.Nonfunctional” with inventory item name in faulty state as the meta data in the event logs.