3. Release notes
Please scroll to the bottom to view known issues, installation instructions and OS compatibility information.
3.1. Version 3.11.2
New features and fixes for this release include:
There is a new, more efficient data lookup method for the
libpvalibrary, resulting in a 20% to 40% speed increase for rendering the Execution Trace for most reports.The
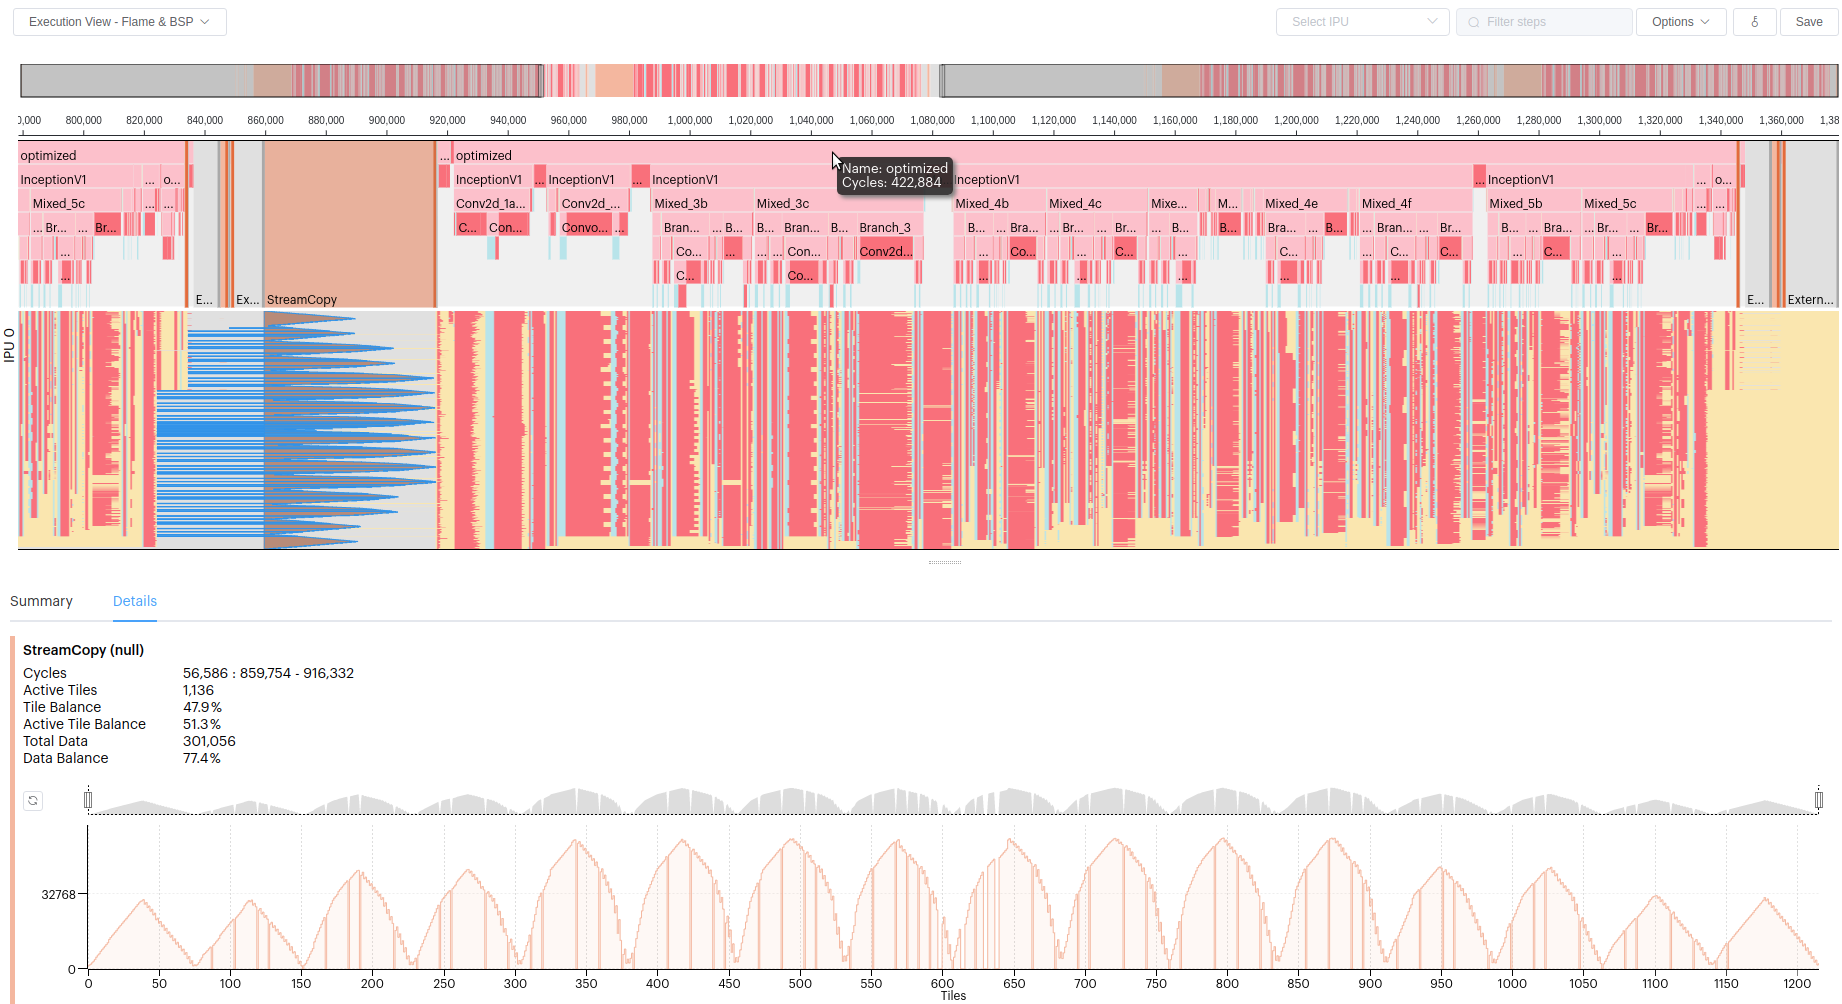
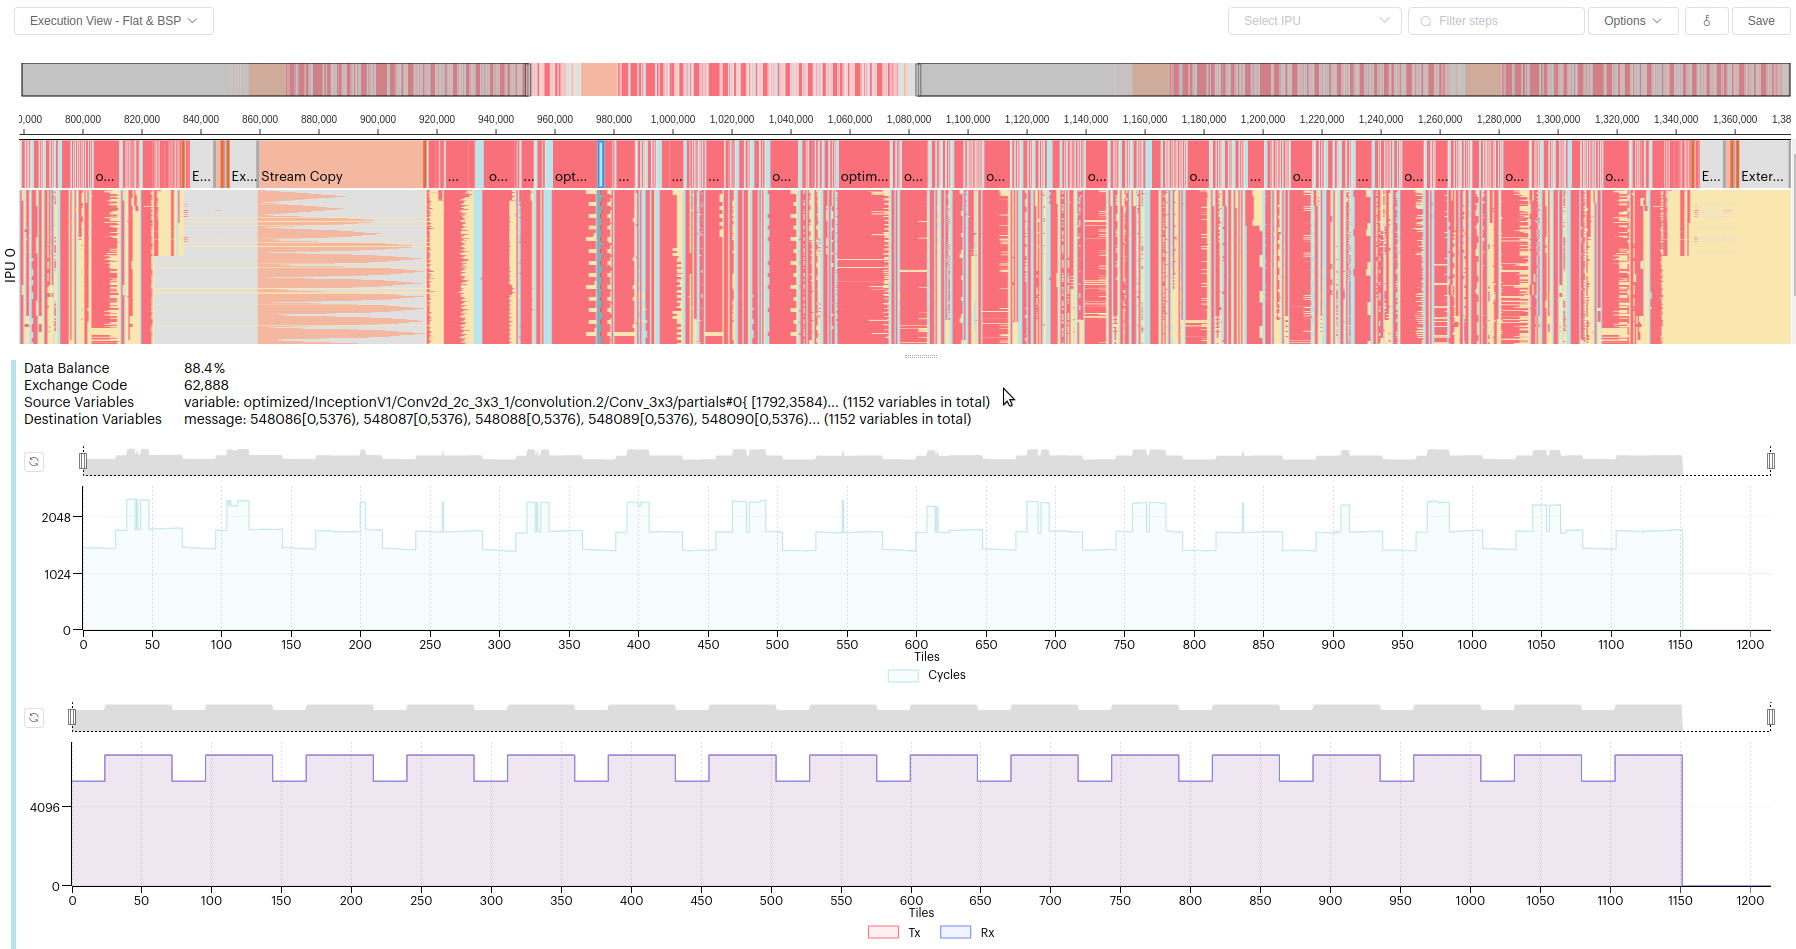
StreamCopystatistics for the Execution Trace report are now split up into separate entries for stream copies to/from host, remote buffer, or a mixture.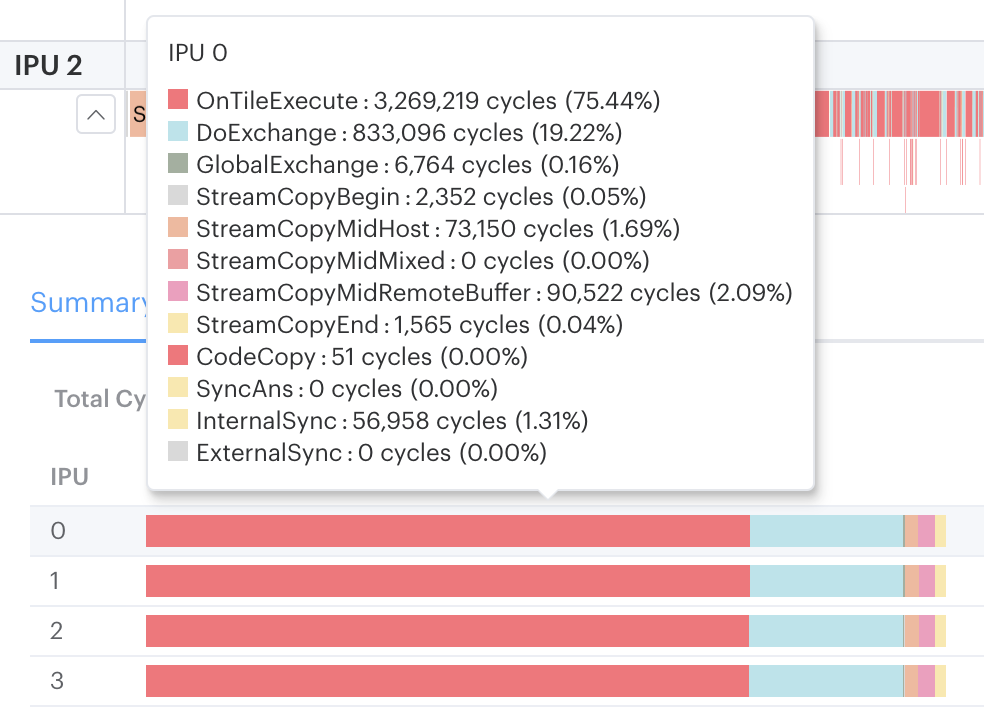
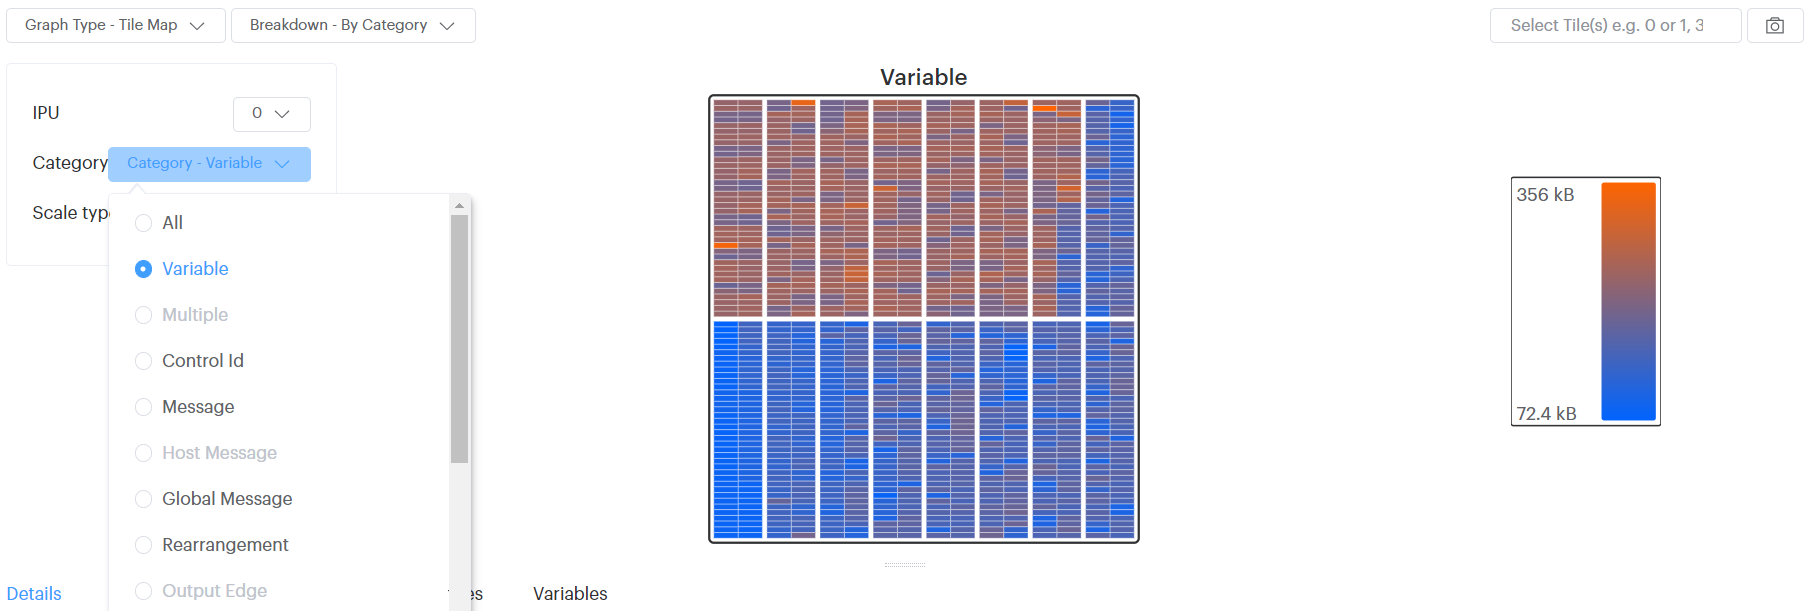
The
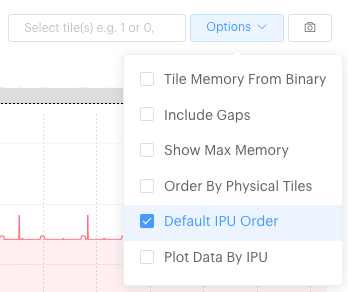
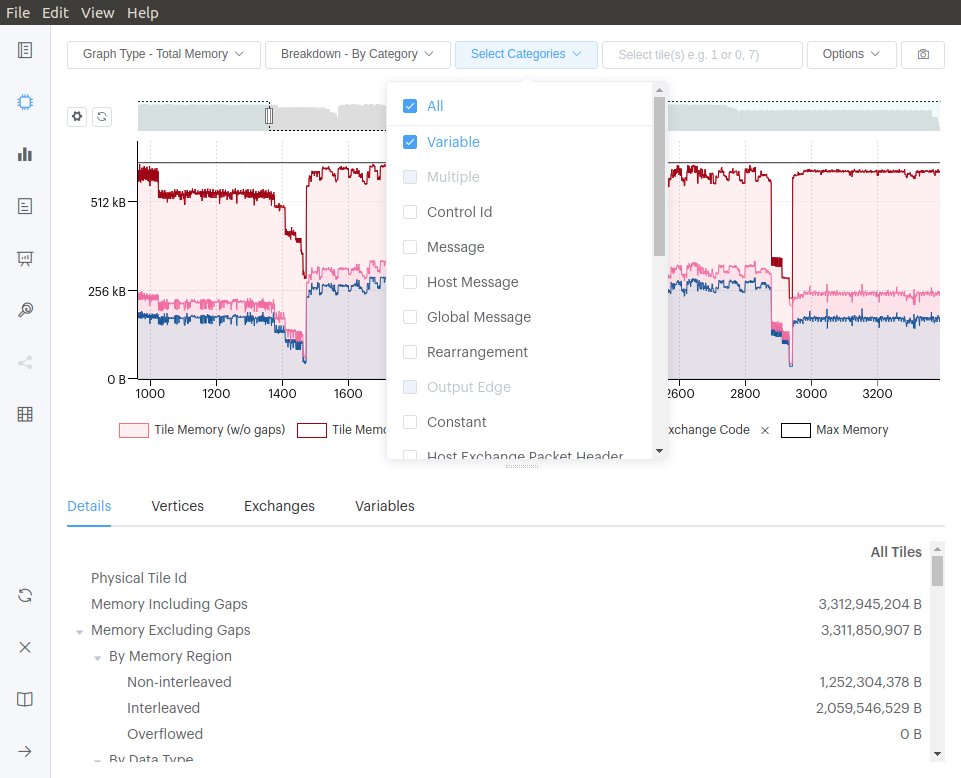
StreamCopyMiddestinations shown in the Execution Trace are now available in the table of execution stats shown in the Summary tab. This should help you to quickly identify excessive communication with a remote buffer, for example.When viewing the Memory Report tile map, you can now select a category of variable type (Variable, controlID, Message, etc.) to see the associated memory usage across the tiles.
You’ll see some speed and layout improvements in the Summary and Program Tree reports.
We now preserve the state of the Engine Options filter on the Summary Report, and also whether the Navigation bar is collapsed or not.
Selecting a program step in the Program Tree now correctly highlights the other associated steps, taking into account the selected debug layer.
Fixed a bug where the current search and scroll positions in the Program Tree report were not preserved after viewing other reports.
Fixed a bug in the Execution Trace report, when comparing reports, where data from the source report was sometimes not displayed.
3.2. Version 3.10.0
22nd August, 2022
Please note that the End User License Agreement (EULA) for this release has changed, so you will need to agree to the new version.
New features and fixes for this release include:
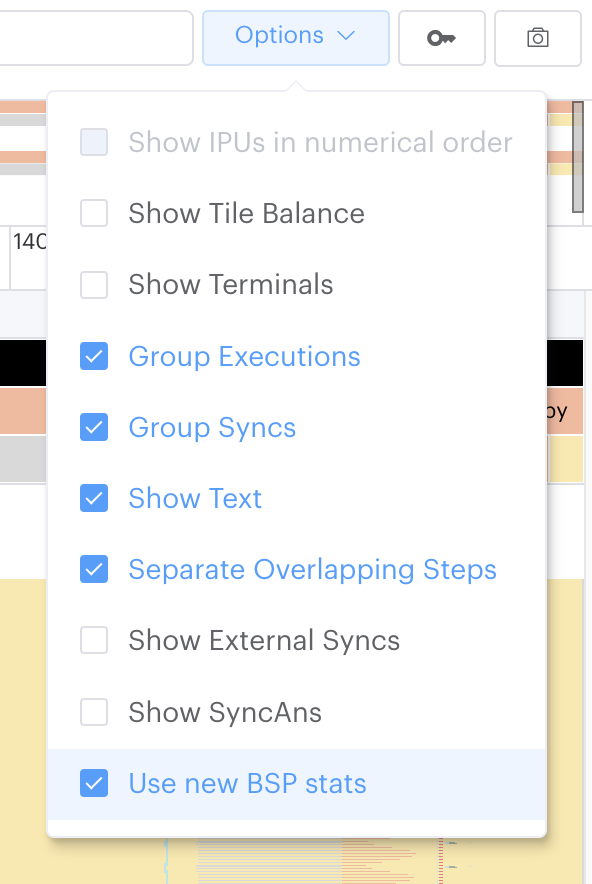
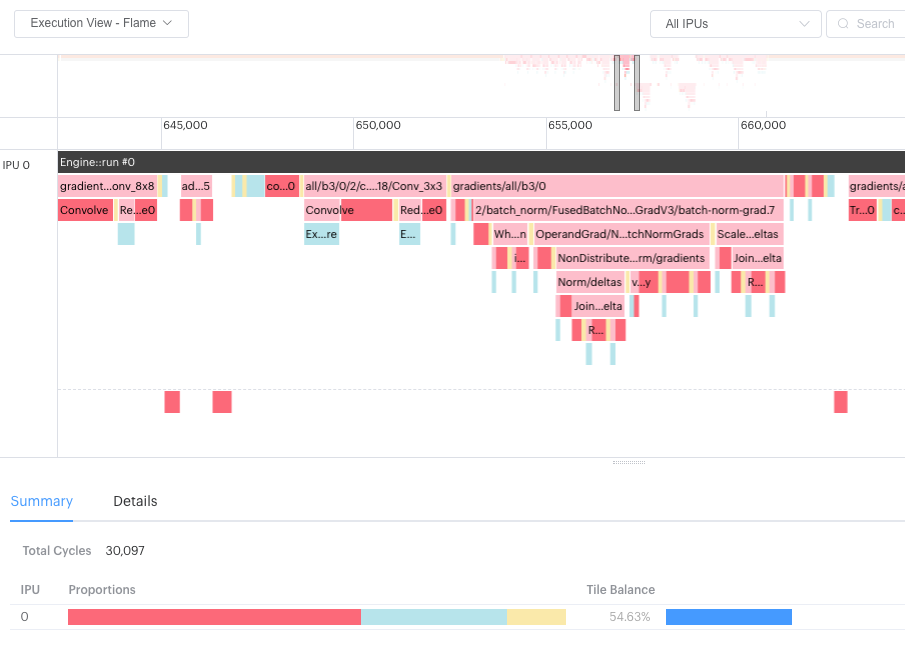
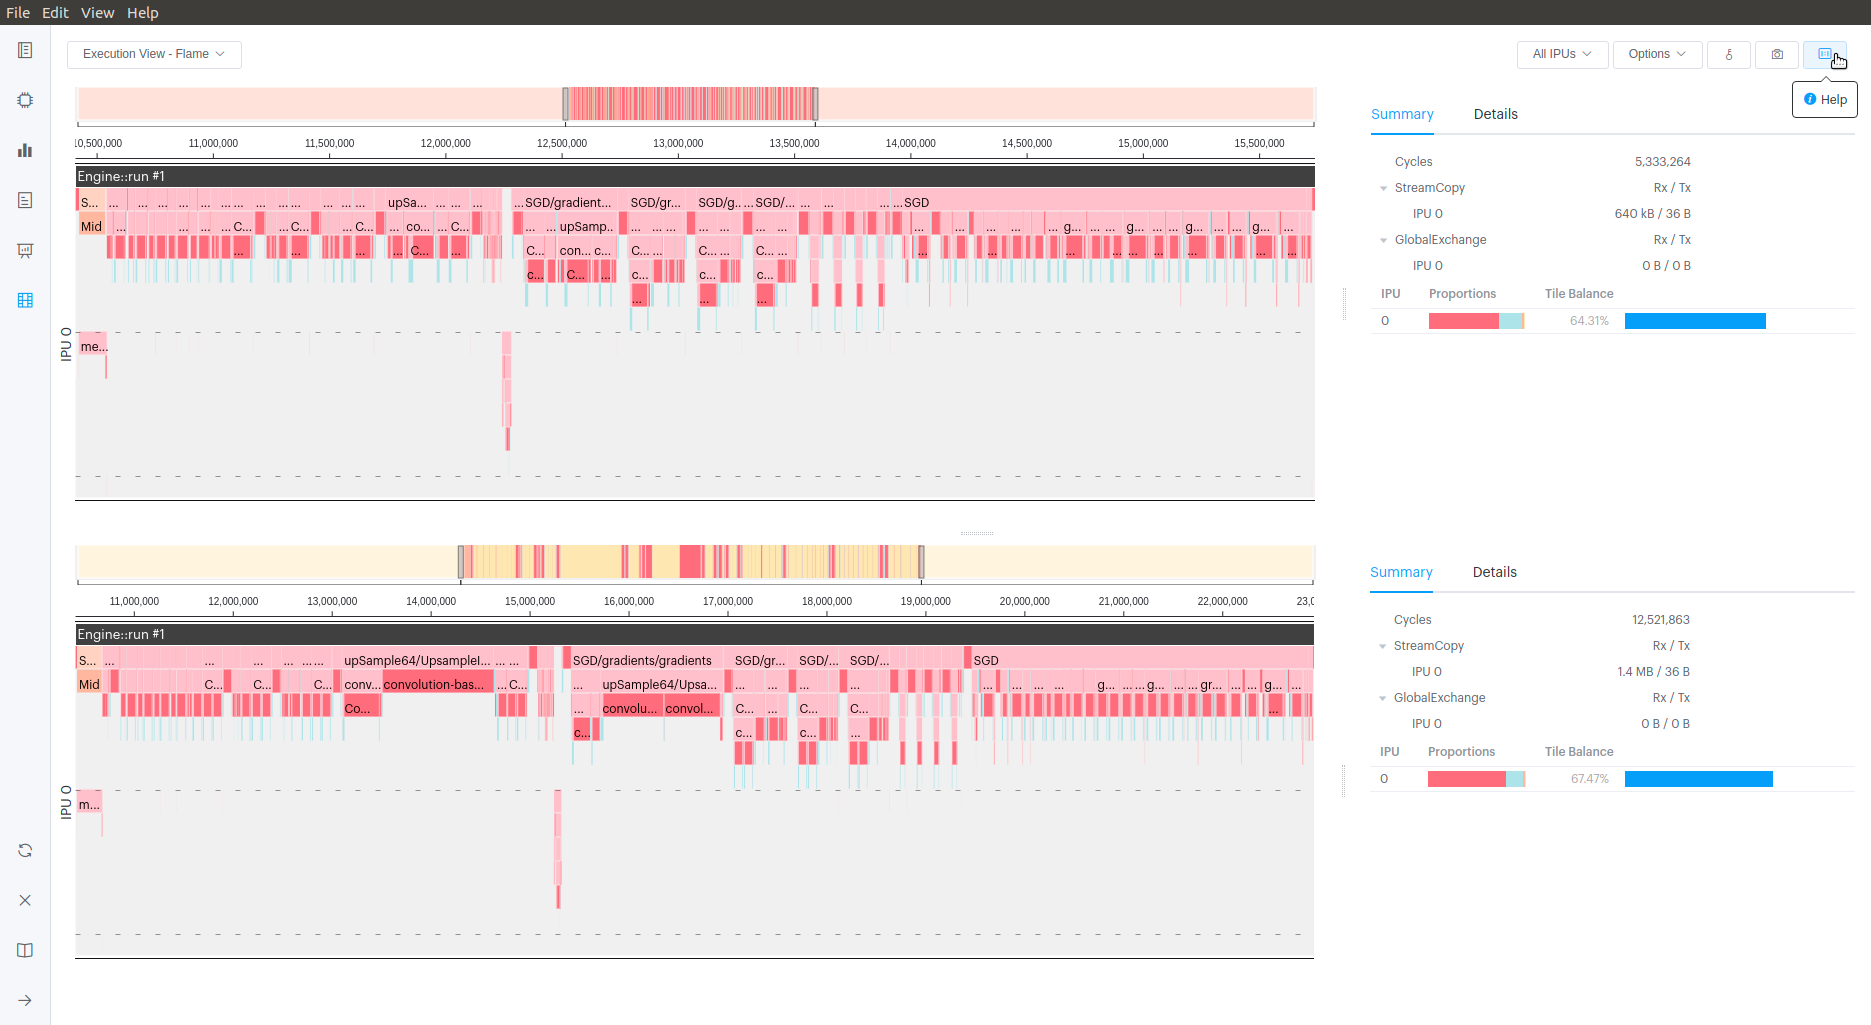
The Execution Trace now calculates more accurate statistics for the tiles and cycle range that are in view. The Tile Utilisation metric, shown by default, measures the proportion of tile-cycles that are spent on processing or transfer steps. See the ‘New BSP statistics’ section of the help for more information.
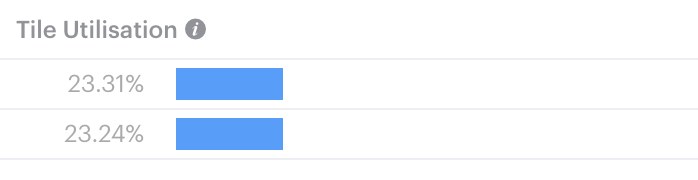
To show the Tile Balance metric instead, which calculates statistics with the previous method, you can disable the ‘Use new BSP stats’ option in the Execution Trace.
The modifier key that you press to select multiple points on a graph has changed to Ctrl , for Windows and Linux, or Command , for macOS. Previously it was Shift for all platforms.
The Operations Summary now supports the PyTorch debug context layer, which allows PyTorch programs to display more useful information.
The performance and loading time of the Program Tree has been improved when a single, large report is open. Also, when navigating between search results, programs in the tree are automatically expanded if needed to make the current search result visible.
‘Lanes’ in the flame- and flat graphs of the Execution Trace can now be collapsed, such that only the top row of blocks is shown, by clicking the icon at the left-hand edge of the lane.
When an invalid tile or IPU number is entered in the “Select Tile(s)” input of the Memory report, an error message is now shown which gives the maximum number present in the data.
The positions of the buttons to navigate between search results in the Execution Trace and Program Tree have been swapped, such that the buttons to skip forward or backward by ten results are closest to the edge of the dropdown region.
The height of GlobalExchange blocks in the Execution Trace has been reduced such that they are consistent with the other blocks.
The BSP trace no longer sometimes fails to load after opening and closing large reports in quick succession.
For exchanges that do not transfer data on an IPU, an invalid Data Balance % is no longer shown in the Execution Trace.
The tooltip shown for the Liveness graph now formats its y-axis values in bytes.
3.3. Version 3.9.1
25th July, 2022
New features and fixes for this release include:
We have a new tutorial for using Lightweight Profiling. This allows you to select exactly which steps of your program you want to profile instead of the default Poplar instrumentation, giving you a smaller execution overhead, smaller report profiles, and allowing you to focus on the steps you’re most insterested in. You can see the new tutorial in the GitHub tutorials repository
Changing the option to view/hide buffer flushes introduced by lightweight profiling also now correctly updates the cycle range and refreshes the corresponding mini-map view.
We’ve added a new documentation section that suggests ways to reduce the size of the profiles being generated. These suggestions are naturally dependent on your model, but there are usually several options available, for example, reducing the amount of instrumentation, adjusting the number of steps being profiled, or reducing the batch size.
The Graph Analyser can now read v2.8 Poplar profiles (as generated with SDK 2.6 or later).
The names of the reports on the Recent file list are now truncated, so you will no longer see a horizontal scroll bar. You can see the full name when hovering the mouse.
We’ve moved some of the initial profile-loading work into the background, allowing you to access parts of the report more quickly once they’ve been opened.
If all the FLOP estimates are zero, we now display an appropriate message, rather than attempting to plot an empty graph.
When comparing two memory reports, the ‘Liveness’ option has been moved from the ‘Graph Type’ menu into the ‘Breakdown’ options, so it matches the options presented for single reports.
When comparing two reports, we now prevent errors being shown if either of the reports is missing a frameworks.json file.
The screen split proportion for the Liveness report is now saved automatically, and the setting persists between views.
If you have no remote files in your ‘Recent’ list, that column is now collapsed, giving more space for the local file paths.
We are now showing the correct origin and destination (host or remote memory) for StreamCopy operations in the Program Tree and Execution Trace.
The Memory report’s tile map view now shows the correct software/physical tile ID mapping.
3.4. Version 3.8.0
14th June, 2022
New features and fixes for this release include:
The Graph Analyser now comes packaged with a Demo Report that you can use to try out the application’s features. Click the ‘Open Demo Report’ button on the main page to view it.
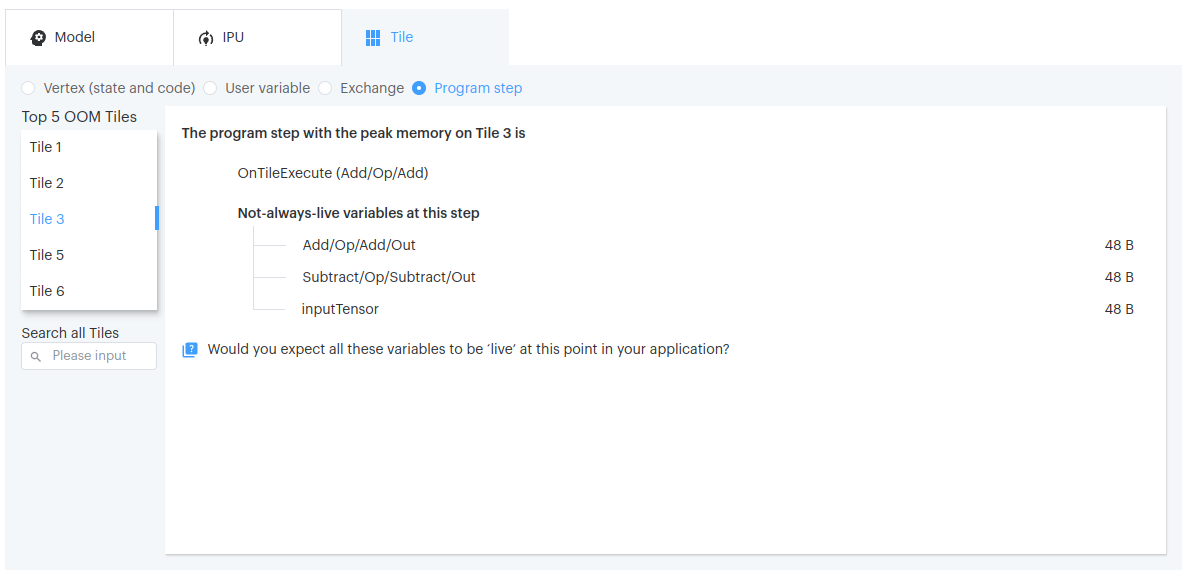
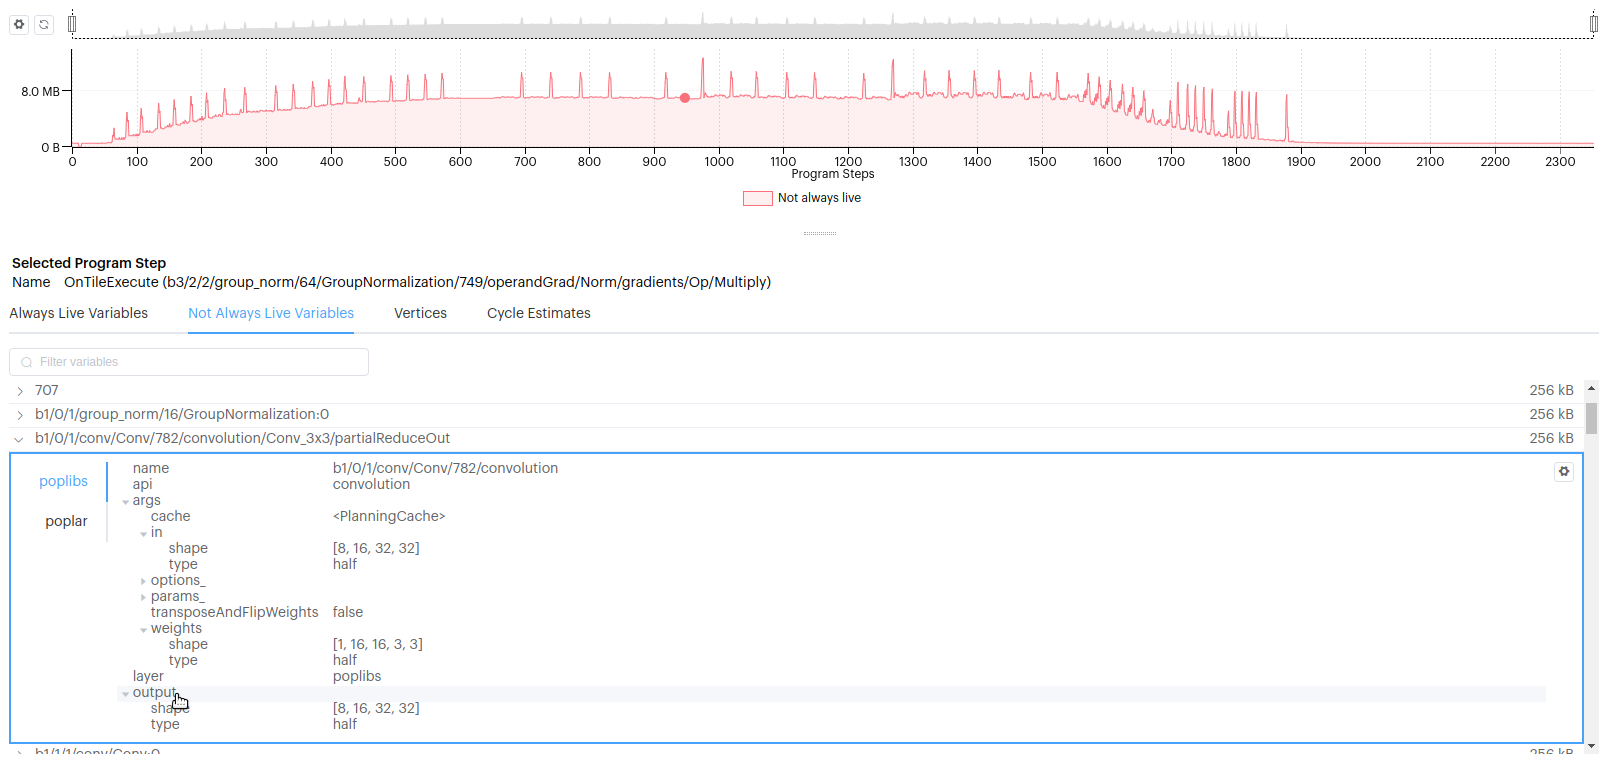
The Insights report now shows the always-live variables and the not-always-live variables (at the peak step of liveness) for model, IPU and worst tiles.
In the FP16 optimization section of the Insights report, we now display a list of FP32 variables (on the five worst tiles, at the worst step) that could be candidates for changing to FP16.
The Memory report now remembers whether you want to display the Variables tab contents as a memory map, or as a table.
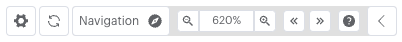
You can now type the magnification you want to zoom to in the graph navigation panel, rather than just selecting one of the pre-programmed magnification levels.
We have included instructions for connecting to the Graph Analyser from MacOS using X-forwarding. Please see the FAQ section of the in-app documentation for full details.
3.5. Version 3.7.2
25th May, 2022
New features and fixes for this release include:
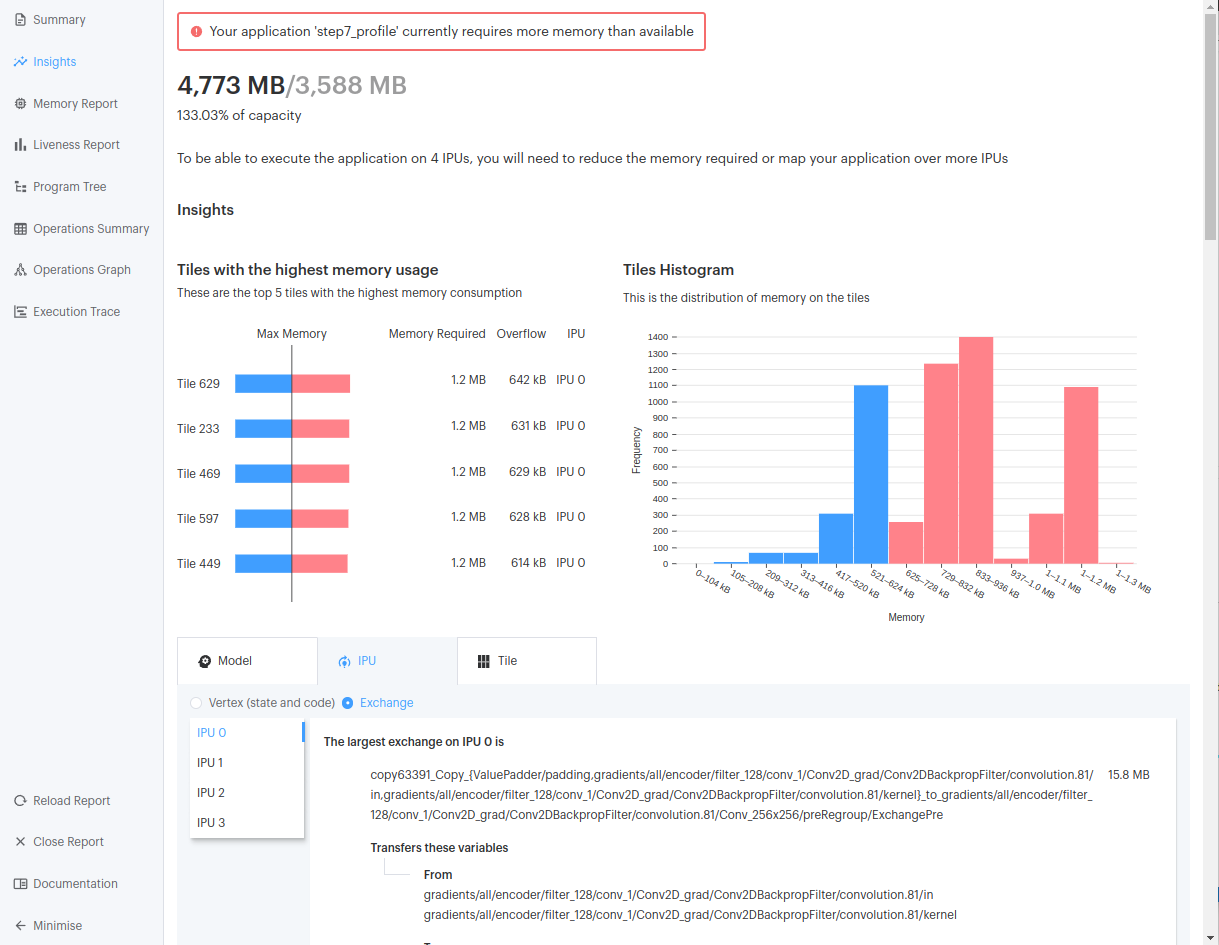
Our new Insights Report gives you a quick overview of the memory usage of your model on the IPU, showing the tiles, vertices and exchanges that use the most memory. The new report also provides some insights and guides for improving memory usage if you are out of memory, such as recomputation, using FP16, or changing the batch size.
Support for the old JSON and CBOR graph profile formats has now been removed. Old reports with these file types will now no longer open in the Graph Analyser.
Selecting a tile on the Memory report now retains that selection when moving to and from the Tile Map display. The options in the Tile Map have also been simplified, and the tile data in the tabs is now properly synchronised with the tile selection.
If the cycles counter in the Execution Trace has overflowed, it now shows a warning, rather than displaying an overflow value of
2^32 - 1.The background colour of the new graph navigation panel has been improved for dark mode.
3.6. Version 3.6.1
12th April, 2022
This release includes many new features and performance enhancements:
Navigation controls are now displayed in the top-left of report graphs, allowing you to zoom and pan with the mouse and keyboard. You can collapse and expand the control, and see the keyboard commands that you can use instead of the mouse.
The effect of scrolling vertically in a report has now been set to ‘scroll’, rather than ‘zoom’ as the default. You can, however, still change this setting in the application preferences.
The styling of the graph tool-tips have been improved, making it easier to read in dark mode.
When selecting multiple tiles on the Memory Report, you will now see a loading message in the Compute Sets tab to show when data is being fetched.
There is now a glossary of terms used in the Graph Analyser, which you can consult at the end of the application’s built-in Help. It contains many links to the Poplar documentation to help you understand exactly what’s being displayed in the Graph Analyser.
All tables in the liveness and memory views now have options to sort by column.
If you’re using the TensorFlow option to select the IPU ordering for a pipelined model, this order is now stored in the frameworks.json file and the order is reflected in the Memory report and the Execution Trace.
The BSP Trace in the Execution Trace has seen a considerable performance improvement for large reports.
You can now open Graph Analyser reports by double-clicking on a profile.pop file from your OS’s file browser (not supported on Linux).
When you start up the Graph Analyser, you are presented with a new dialog that asks your permission to collect telemetry data about your use of the PopVision tools:
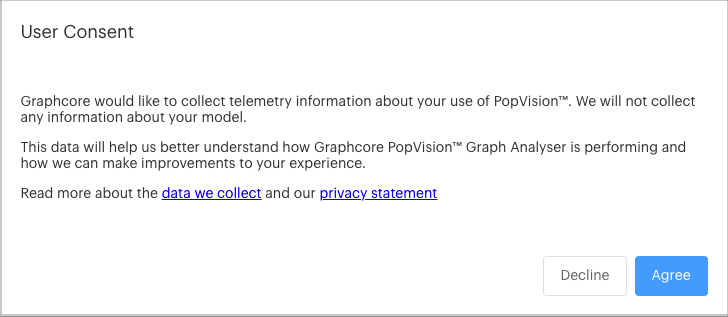
This helps us better understand how the application is performing, and how we can make improvements to your experience. No information about your models is collected. Please consult the documentation to read about the data we collect, or view our privacy statement on the Graphcore website.
3.7. Version 3.4.1
21st February, 2022
This release includes many new features:
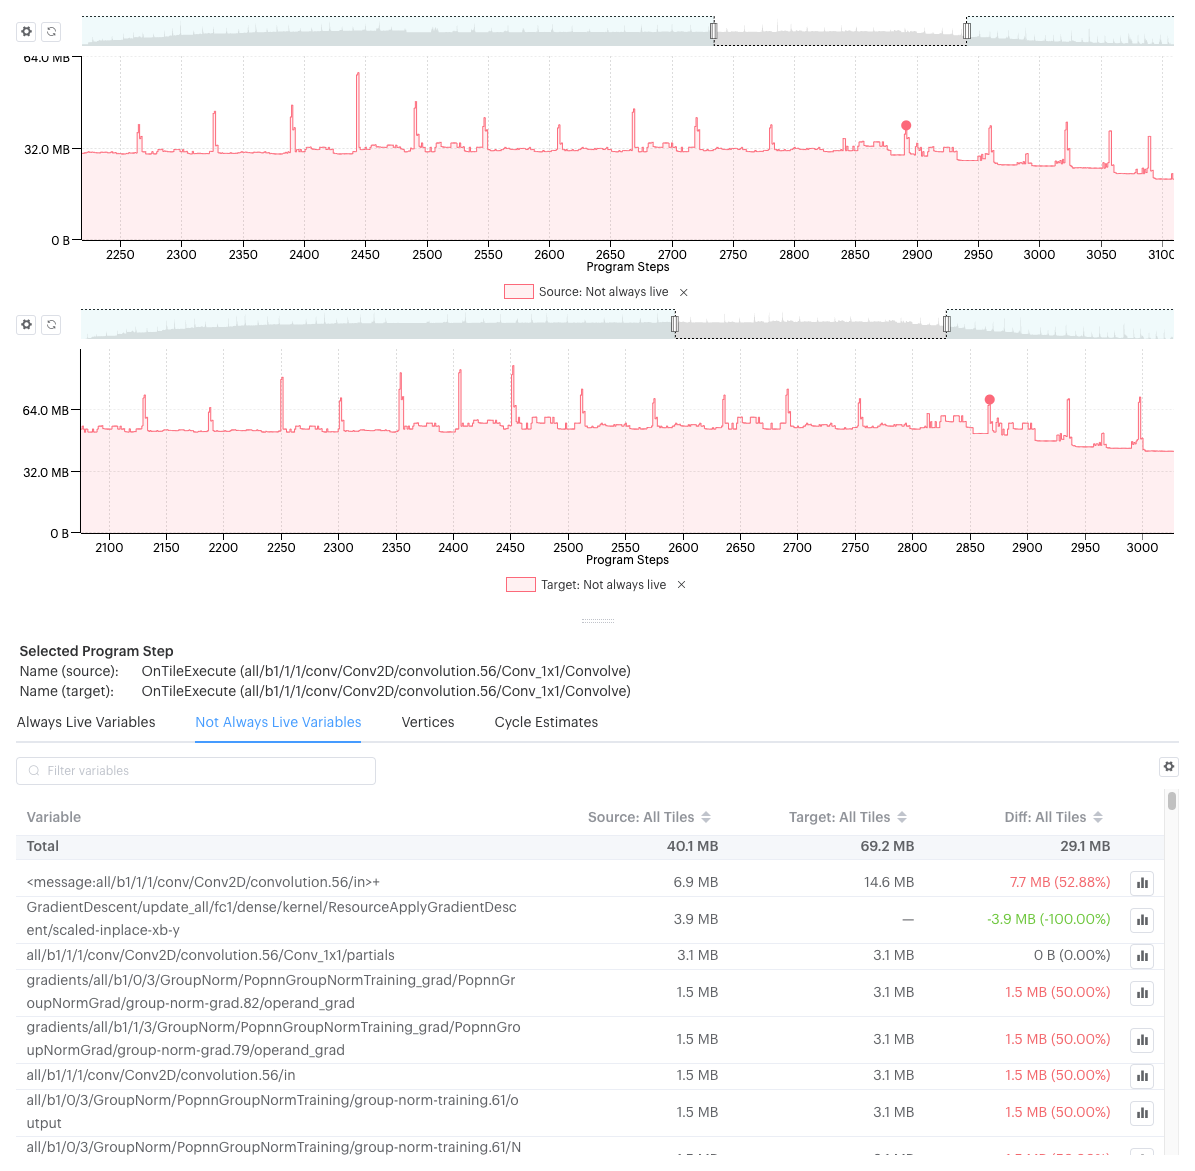
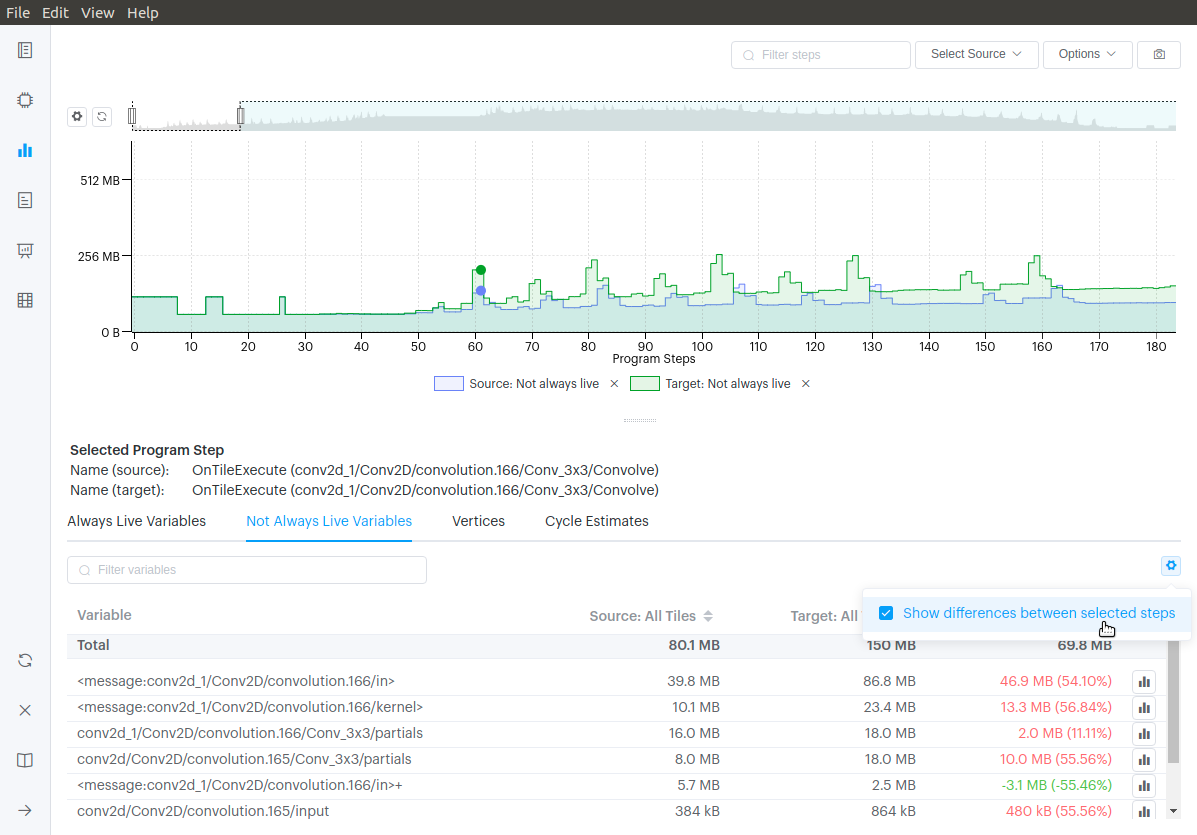
When comparing two reports on the Liveness report, you can now see two graphs displayed for the source and target data. This allows you to select different program steps on each report to compare their details.
We’ve fixed an issue where the analysis engine would fail to upload when comparing two reports on a remote machine.
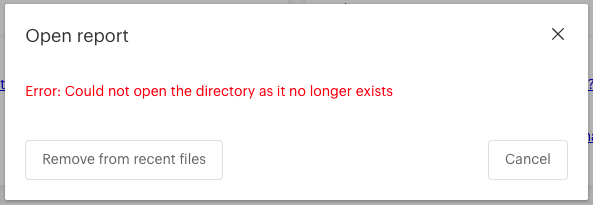
Report folders that have been moved or deleted can now be removed from the Recent reports list on the landing page.
When selecting a program step in the Program Tree report and viewing its vertices, you can now sort them by vertex type, memory size or number of instances in the program step.
3.8. Version 3.3.1
21st January, 2022
Features in this release include:
You can now see the compute steps associated with a selected tile(s) or all tiles in the Memory Report. A table shows details of the compute steps, including their size, vertices and number of instances. You can also filter the table to find vertices in matching compute set names.
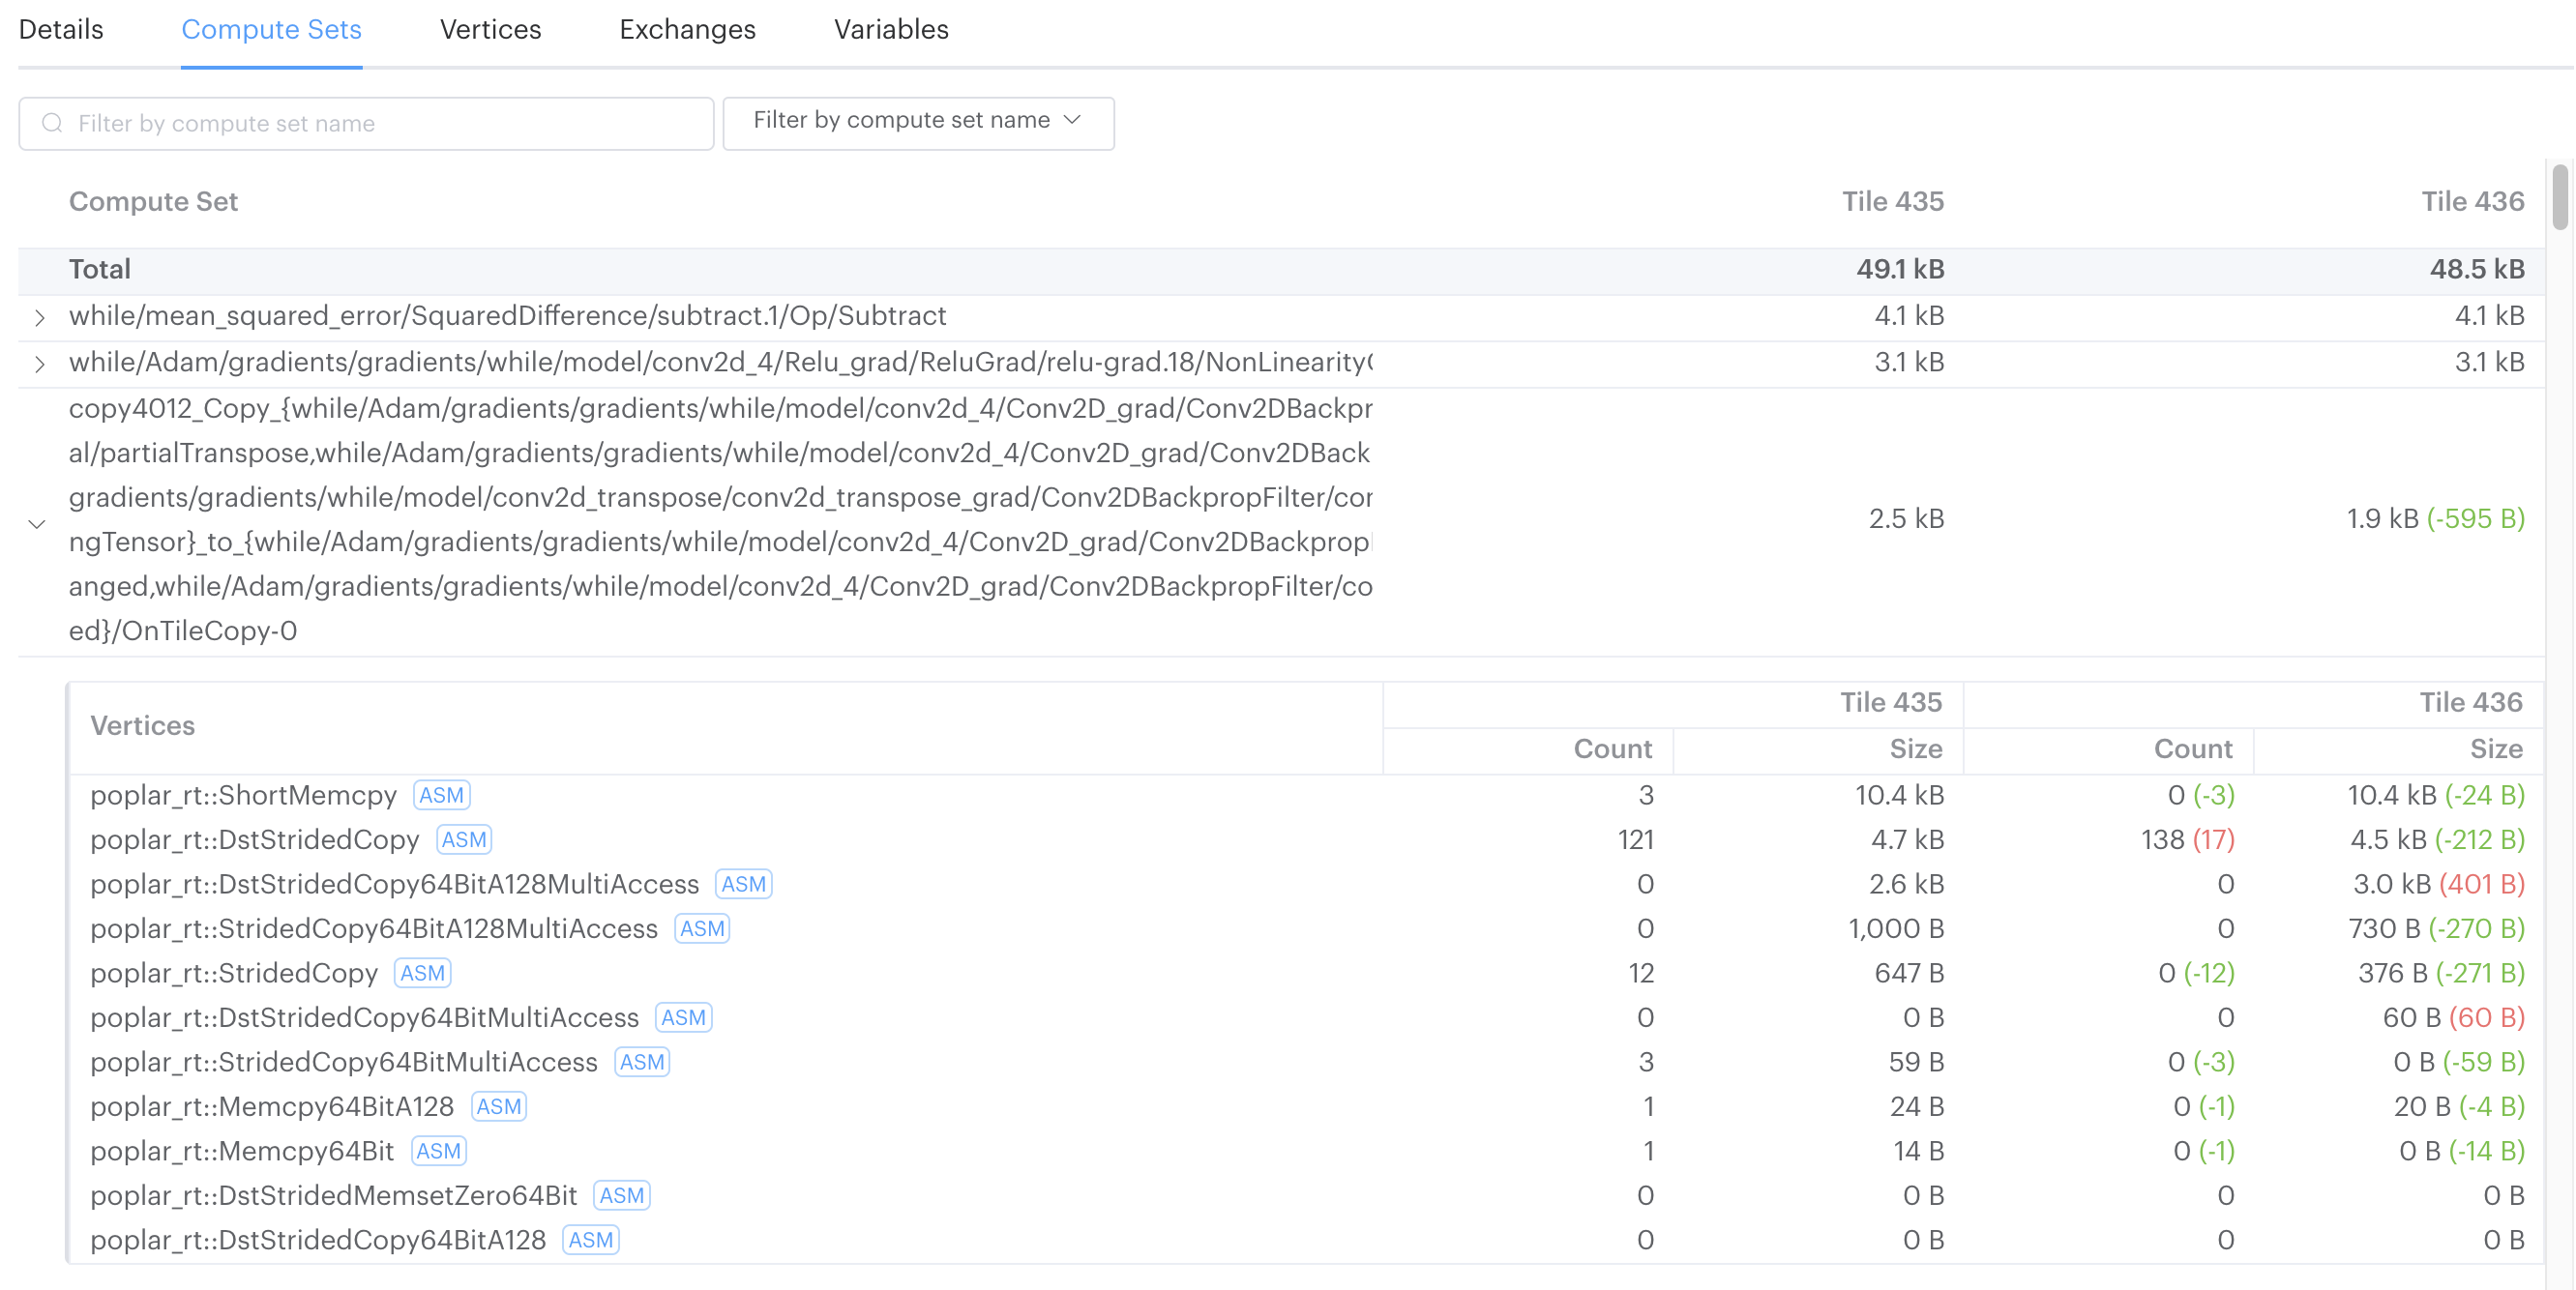
There are continued improvements to Execution Trace rendering speed - now, only event blocks for visible IPUs are loaded.
3.9. Version 3.2.0
20th December, 2021
This release adds several new features, and addresses some display and error-reporting issues in previous versions.
The ‘Open file’ and ‘Compare reports’ dialogs now display a drop-down list of directories which updates to match the path entered. You can use the keyboard arrow keys to navigate and select paths from the list.
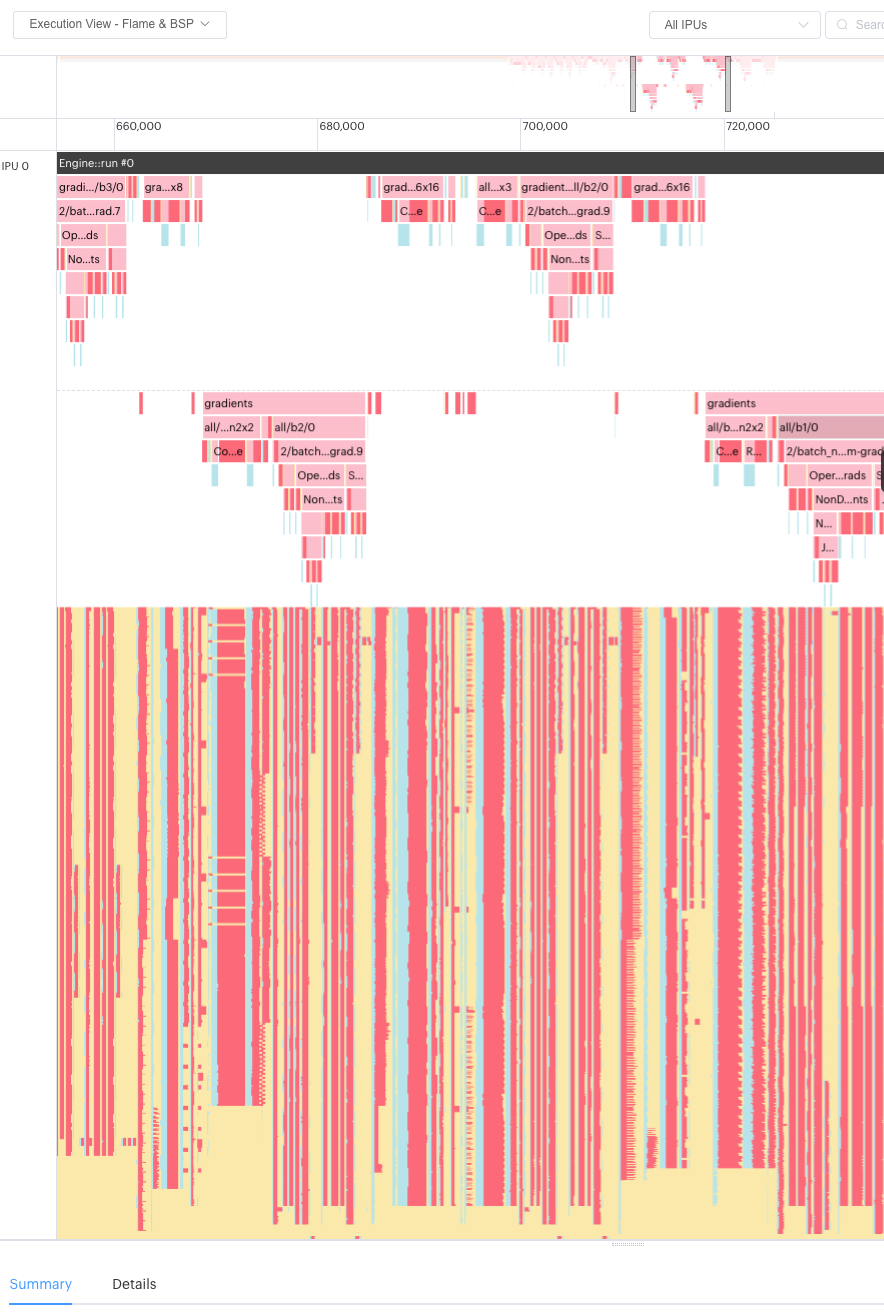
You can now zoom in and out vertically on the Execution Trace BSP display, allowing you to see individual tile activity more easily.
Dialogs can now be toggled between their default size and full-screen by clicking the resize icon to the left of the dialog’s title.
If there is no current selection on a report’s graph, tabs that would otherwise be empty now display a message such as “Please select a tile to see its details”.
Fixed an issue where the differences between selected steps in the Liveness report was not being calculated correctly.
Fixed an issue when using SSH keys generated with the OPENSSH format.
Errors that occur while downloading or installing an update are now displayed in a notification. If the download takes longer than a minute to complete, the option to retry it or continue is presented.
Increased the size of the Recent files list.
Fixed issues when the BSP trace failed to load.
Fixed an issue where old reports without execution run information were not displayed.
3.10. Version 3.1.1
16th November, 2021
This version sees many new features and performance improvements brought to the Graph Analyser.
We have implemented more rendering improvements in the Execution Trace, which shows more detail in flame graph view, and when zoomed out. This is also reflected in the ‘mini-map’ overview at the top of the report, making it simpler to see execution steps that would not have been visible before.
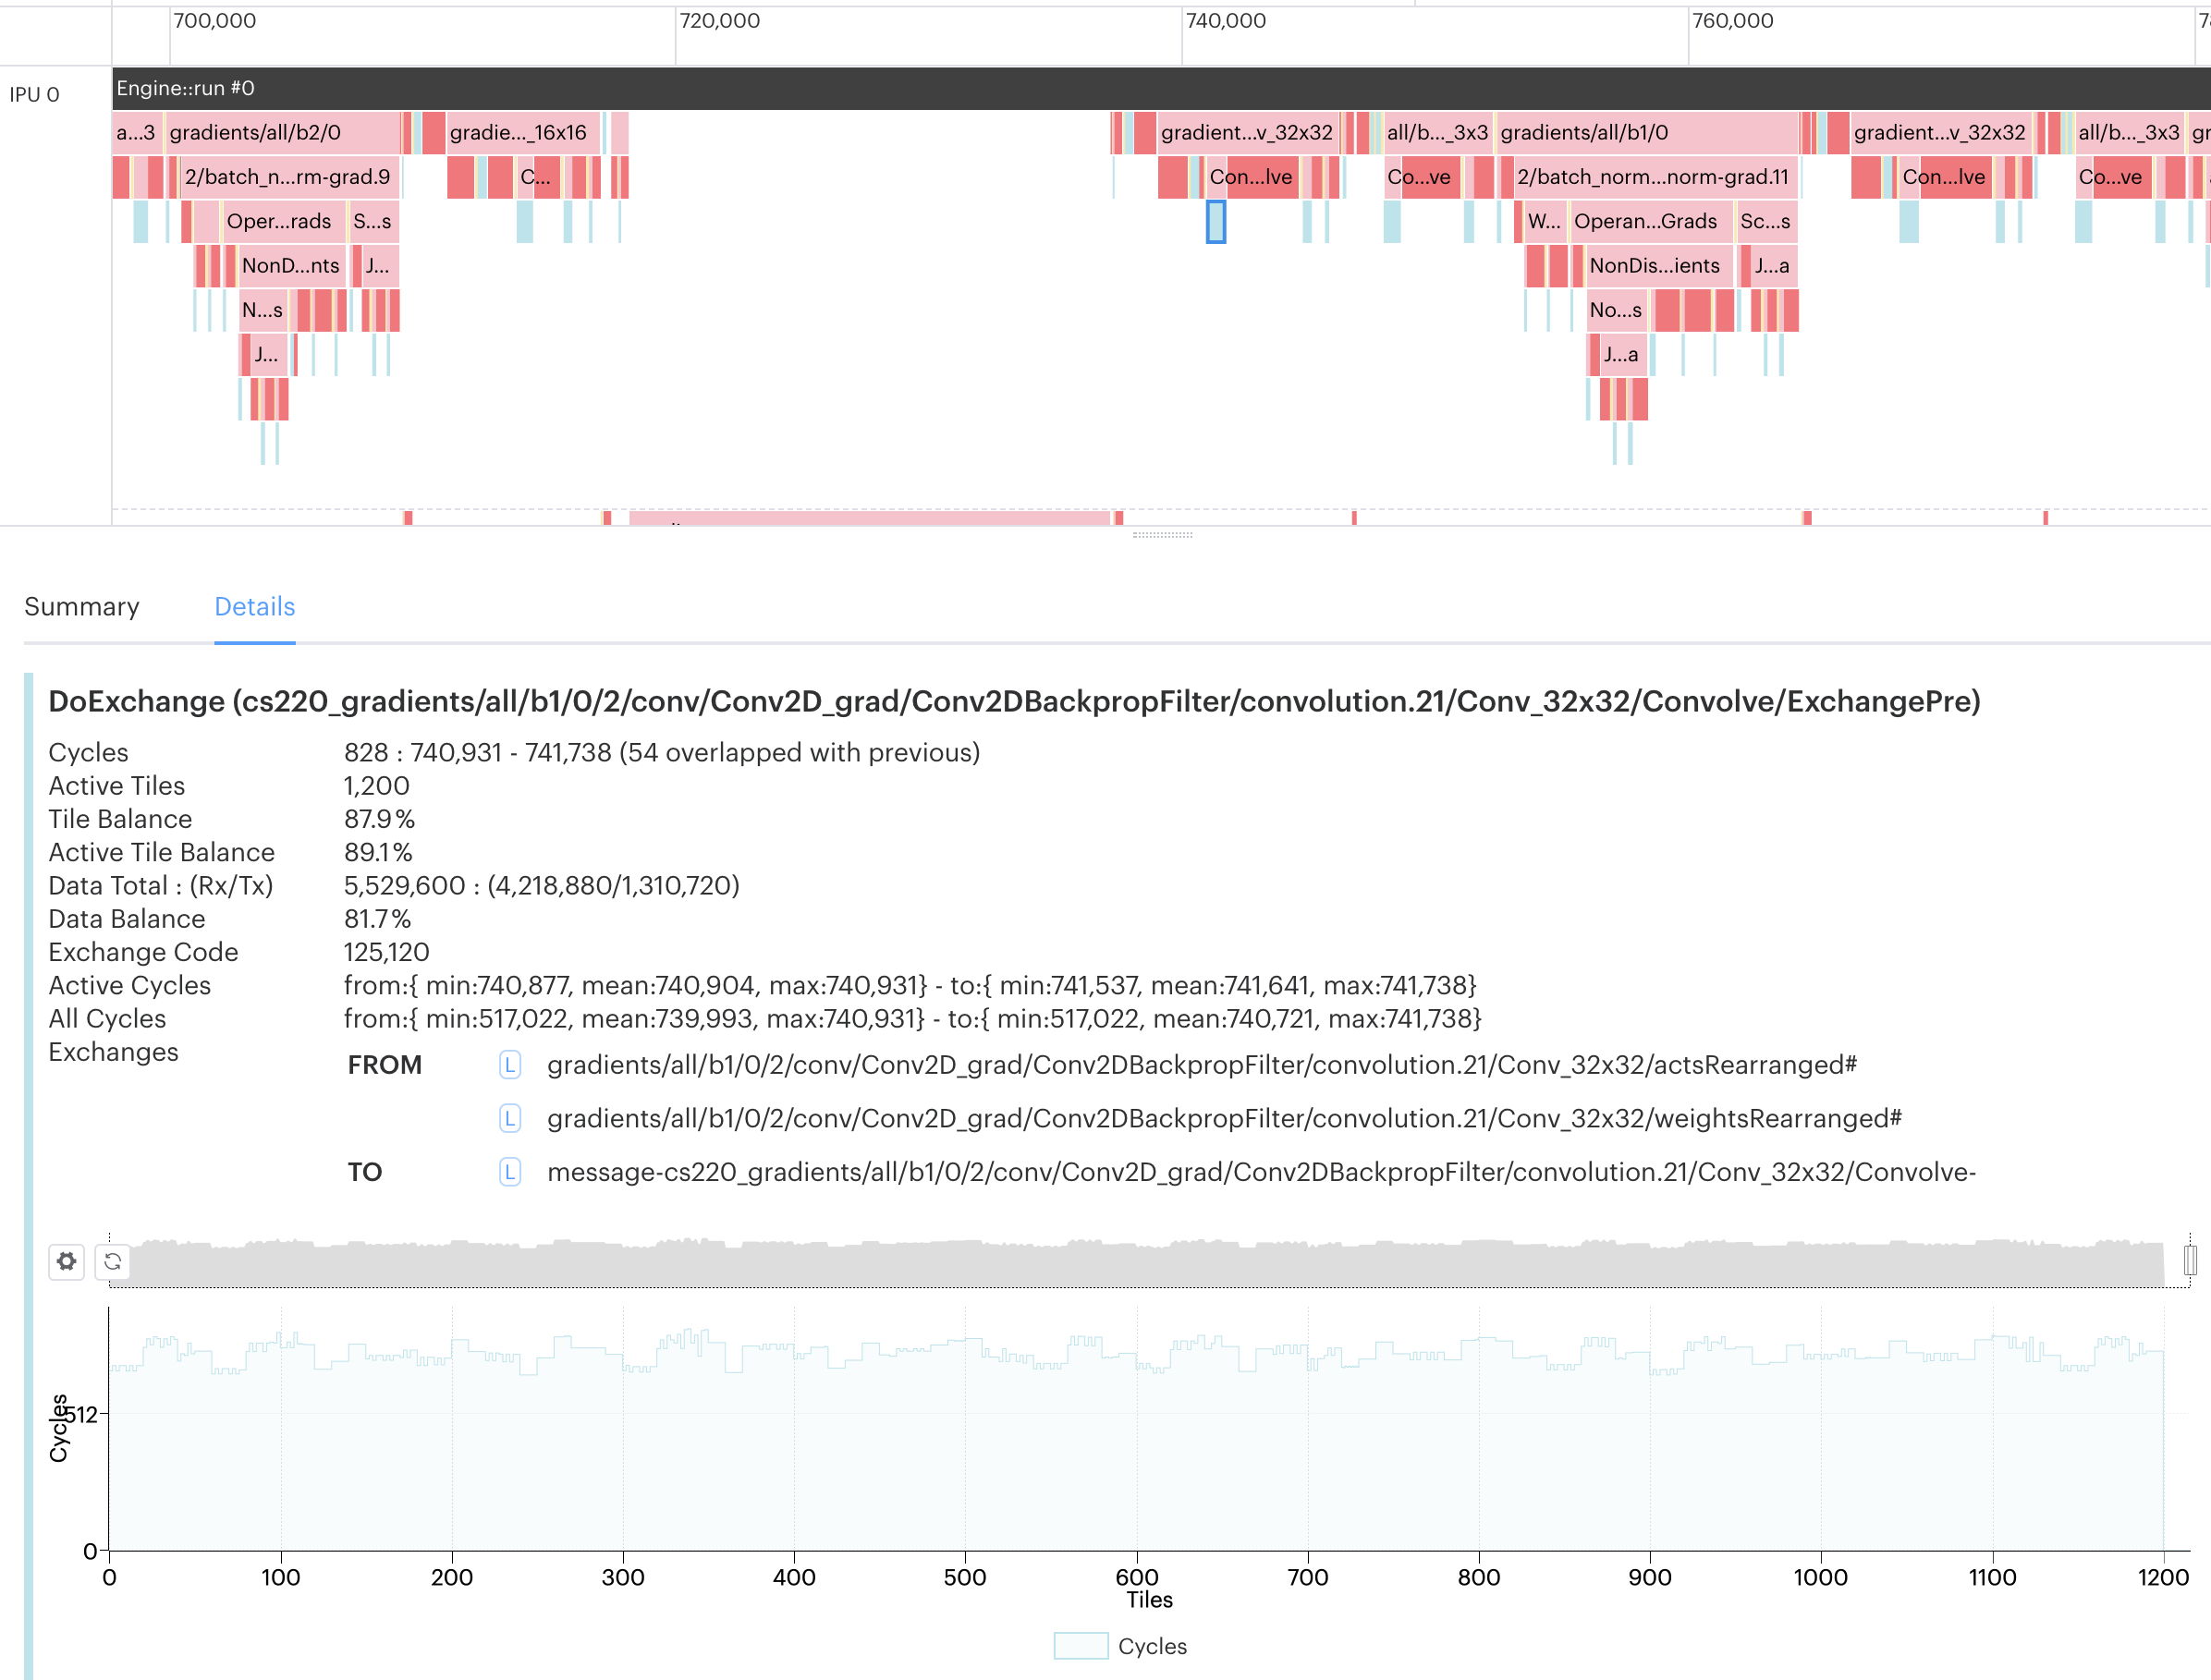
Exchange information is now displayed in more sections of the Graph Analyser reports. Details of selected exchange events (StreamCopy, DoExchange, GlobalExchange) can now be seen in the Program Tree, the Execution Trace, and when comparing two Memory reports.
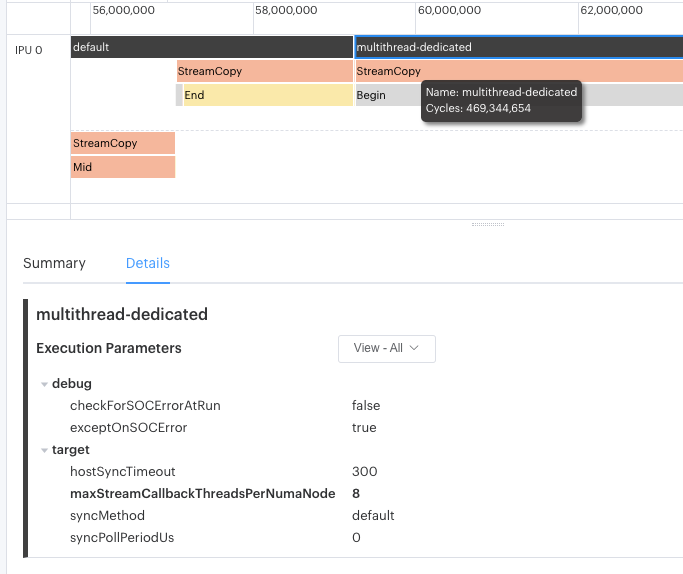
Execution parameters are now displayed on a ‘per-run’ basis. On the Summary report you can select the Engine Option ‘Execution’ type, and then select which run’s execution parameters to view. On the Execution Trace report, you can click on the run bar at the top of the graph to display the associated execution paramaters in the Details tab.
The range of colours in the Liveness Report graph has been improved ro provide better visibility and contrast.
When comparing two Program Tree reports, selecting a program step now shows the step details in tabs below the trees, as for the single report.
Selecting a tile in the Memory report now filters the variables based on which tile they’re on, showing the lowered and unlowered variable names. If multiple tiles are selected, the behaviour is the same above, but lowered variables are displayed for all the tiles selected.
3.11. Version 3.0.3
27th October, 2021
Version 3.0 of the PopVision™ Graph Analyser sees many new features and improvements, including:
Improved the Execution Trace view to support larger profiles and be more responsive.
Improved screen captures.
The CodeCopy program is now supported throughout the application.
Automatic software update.
Added more information to the exchanges (StreamCopy, DoExchange and GlobalExchange) to show the variables involved.
A new preference allows you to set the default behaviour for your mouse’s scroll-wheel: zooming or scrolling?
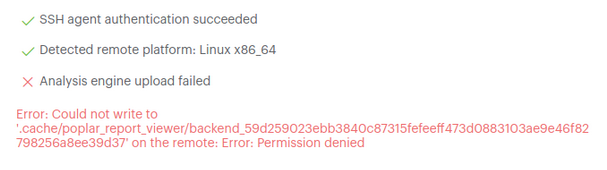
Better error reporting if the analysis engine upload fails.
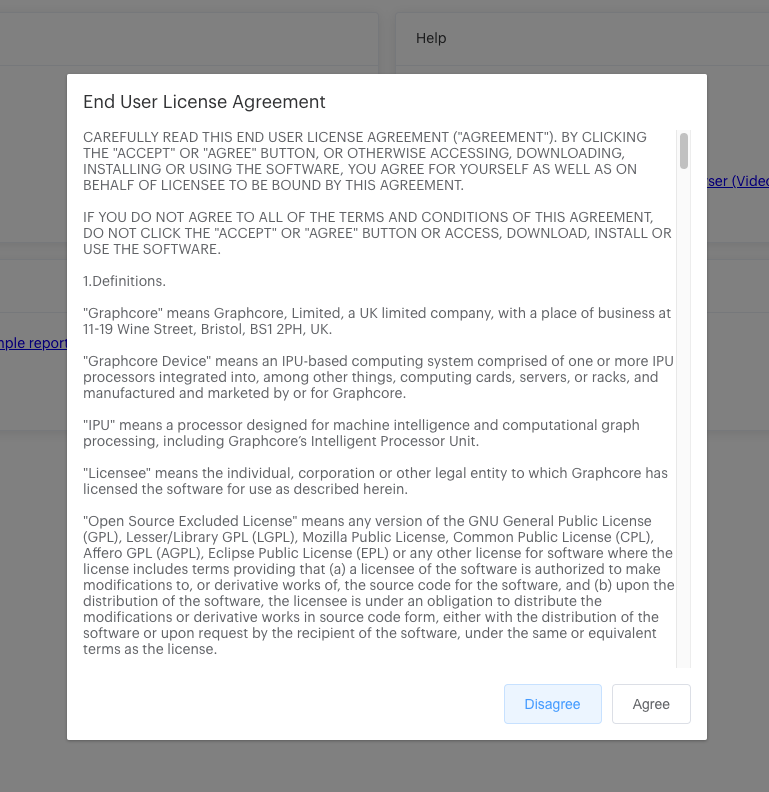
An End User License Agreement must now be agreed to before using the application.
3.11.1. General improvements
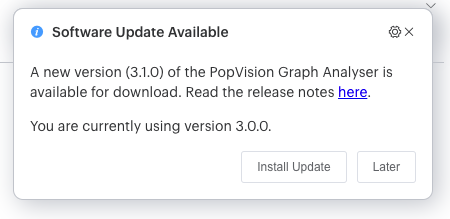
The Graph Analyser now periodically checks to see if there is an update. If it finds one, it prompts you to download and install it. You can delay the download, or switch off the feature entirely in the Preferences.
If you’ve previously delayed an update, you can use the ‘Check For Updates…’ menu option to check manually, without having to wait until you’re prompted again.
To support software update functionality, when first starting the application an End User License Agreement is displayed (unless you’ve already agreed to it in a previous version of the application). To continue to use the Graph Analyser application, you must agree to the terms and conditions therein.
In the Preferences dialog, you can now define the default behaviour for your mouse’s scroll wheel (or using two-finger drag on a laptop trackpad).
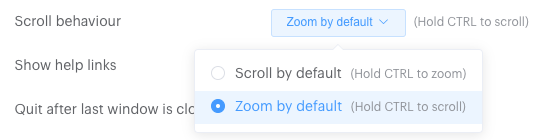
You can choose either:
‘Scroll by default’, where the mouse wheel will scroll the window content up and down. Holding down the Ctrl key while using the scroll wheel then zooms the window content in and out.
‘Zoom by default’, where the mouse wheel zooms the window content in and out. Holding down the Ctrl key while using the scroll wheel then scrolls the window content up and down.
The screenshot functionality now captures just the portion of the report currently displayed, including the information on the tabs in the lower half of the report. Previously, just the graph data was exported as an image.
Image capture now works as standard with all the report windows, including the Tile Map of the Memory Report, and also supports the current theme’s colours.
We have improved the error reporting if the Graph Analyser failed to upload the analysis engine to a remote host. Error reports will now show whether there was, for example, a permissions error, or no space to write the engine.
3.11.2. Execution Trace
We have improved the speed and quality with which the Execution Trace is rendered, making it much more responsive to panning and zooming when large reports are being investigated.
When you open the
profile.popfile in the application, a cache file namedprofile.pop_cacheis created, which the application looks for again if the report is re-opened. There is a menu option to delete theprofile.pop_cachefile if it becomes corrupted.The mini-map now changes its contents depending on whether you are currently looking at a flat graph or a flame graph in the Execution Trace.
You can now select a region in the BSP trace and the corresponding step block in the trace will also be selected.
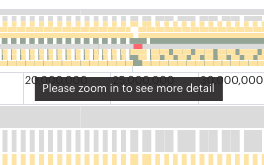
If you have a very large report (greater than around 40 million cycles), single steps are smaller than a pixel wide, and thus are not visible in the Execution Trace. In this event, you’ll see a message at the top of the trace indicating that you’ll need to zoom in to see the detail that has not been rendered.
You can now use the search function in flame graph view as well as flat graph view.
The BSP rendering method has been optimised, so it is now a persistent setting.
3.11.3. Program Tree
In the Program Tree, you will now see the
CodeCopyprogram appear - previously it would be shown as ‘unknown’. This Poplar program is used to move exchange code from non-executable memory to executable memory.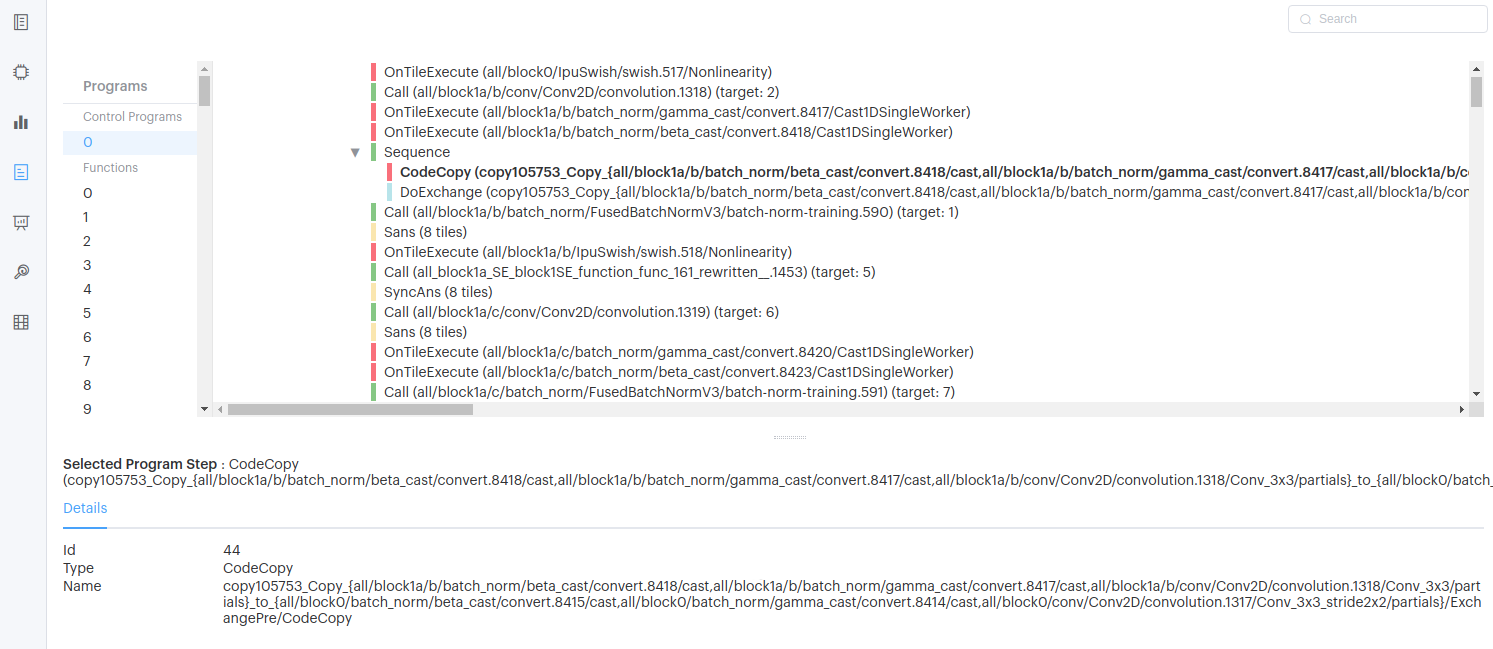
3.12. Version 2.5.5
16th September, 2021
3.12.1. Highlights
Added new option when comparing reports to show them side by side or on top of each other.
3.12.2. Liveness Report
Added new option to show only variables that have different sizes when comparing reports.
3.12.3. Program Tree
Added new menu option to change the orientation of the splitter when comparing reports.
3.12.4. Execution Trace
Improvements to the way the cycle proportions are calculated and how quickly they update.
Fixed an issue which could cause a long delay when selecting a
layerfrom the flame graph that has a lot of steps. The first 32 steps will now be loaded and below that a button to load the next 32 steps is now shown.New menu option to change the orientation of the splitter when comparing reports
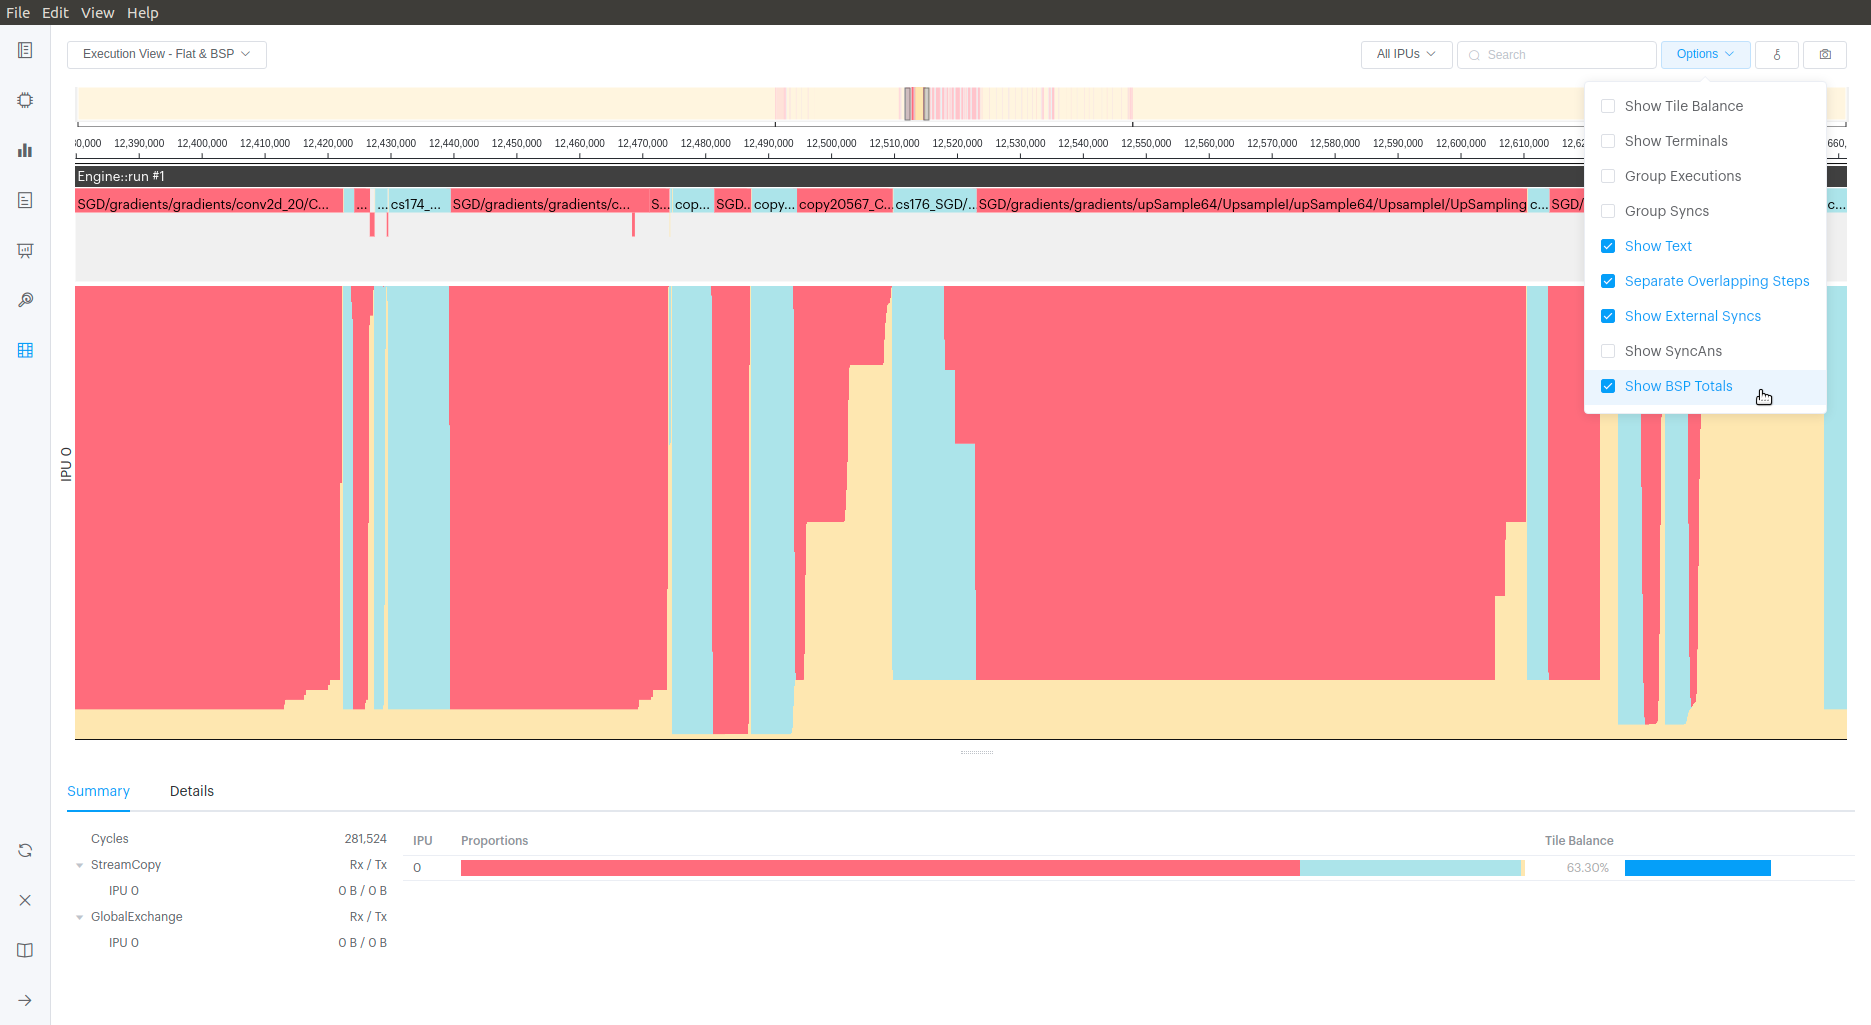
New BSP option to show total number of tiles at each step.
3.12.5. General improvements and bug fixes
Poplar will now by default write the profile files into a subdirectory of
autoReport.directory. The name of the directory is based on the debug name passed to the Engine. This resolves an issue where if you had multiple Engines in a single application (i.e. training and validations) they would write to the same file. See help for more information.The close button on the open report host dialog has been moved to the right.
Fixed an issue that caused the
framework.jsonnot to load when you had a very small profile.Fixed an issue of selecting a step on the liveness graph when comparing reports with different numbers of steps.
Made the spacing between menu buttons consistent.
3.13. Version 2.4.4
25th June, 2021
3.13.1. Highlights
New operations graph report allowing visualization of the TensorFlow High-Level Operations graph.
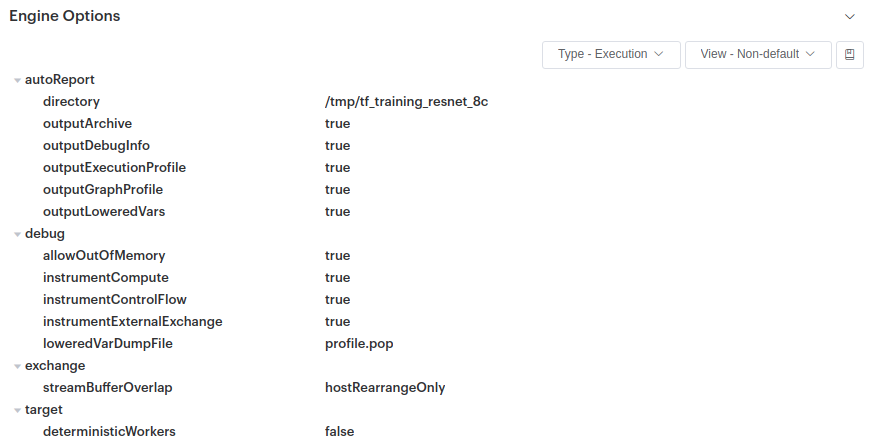
The Summary page shows the Poplar engine options used.
The memory report now includes a breakdown of memory by category.
Liveness can be viewed for any tile or IPU.
Liveness can be viewed for variables.
The operations summary is supported when comparing reports.
3.13.2. Summary Report
The Poplar Engine options which were used to generate the report are now displayed. You can view the options used during the compilation or execution phase.
You can view all values, or only those that are non-default.
Tool tips show a description of the option.
There is a link to the Poplar Engine Options documentation.
Engine options are compared, and differences highlighted, when comparing two reports.
The Summary Report now has collapsible sections, allowing you to display only those details that are relevant to you.
A timestamp is now displayed on the Summary Report, showing when the program was compiled. This timestamp also appears next to the filename on the ‘Recent’ list on the front page.
3.13.3. Memory Report
A new breakdown option, “By Category”, allows you to graph memory breakdown by category (for non-overlapped memory allocations). This for instance can be used to understand the overhead costs of instrumentation. This option is also available when viewing memory by IPU.
When comparing variables on two different tiles in ‘table view’, there is a new option to only show those variables which are different in size.
3.13.4. Liveness Report
Liveness can now be viewed for any tile in your application
Liveness can also be shown for an individual variable, helping you understand on which step a variable becomes live, and on which step it is no longer live. (This was an experimental feature before)
3.13.5. Program Tree
The search function has been improved, allowing you to search for variables by program name. There is also a results navigation display, allowing you to step through search results.
3.13.6. Operations Graph
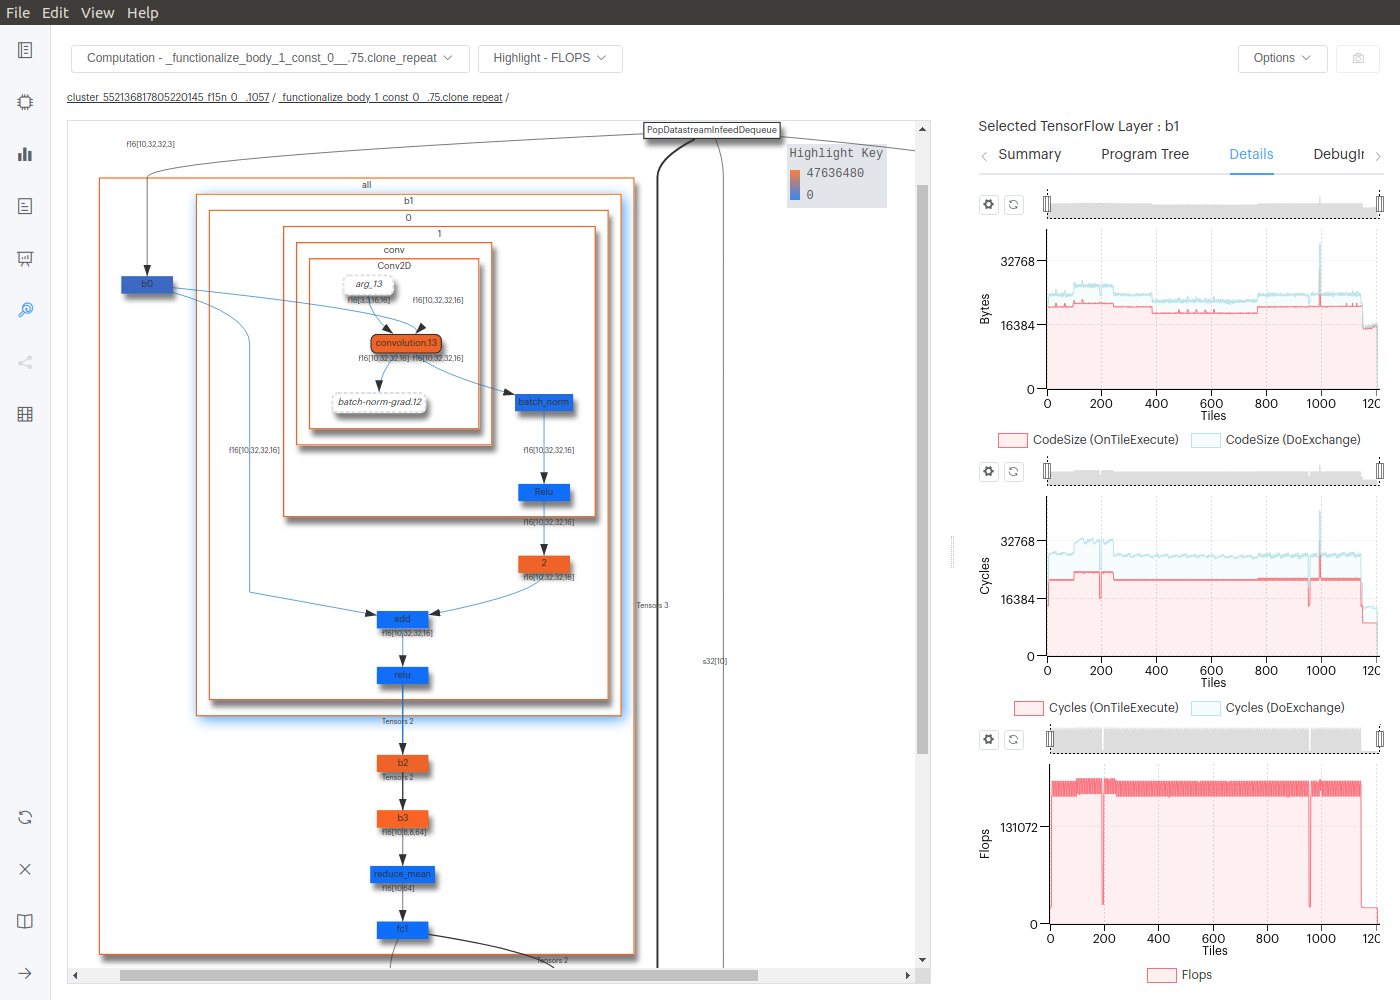
The new Operations Graph displays a graph of TensorFlow High-Level Operations (HLO) for programs built using TensorFlow. This new view allows you to:
Drill down through the modules (subgraphs), expanding and collapsing the layers to see the HLO operations
View details of operations, edges and layers;
Colour items in the graph based on selected metrics (for example, code size of cycles used);
You can configure the layout with a number of advanced options;
3.13.7. Operations Summary
The Operations Summary is now available when comparing reports. You can search for and compare the size of variables based on their operation name or debug name.
3.13.8. Execution Trace
Stream copies that involve the remote buffer are now coloured differently, allowing you to distinguish them easily. The three types are:
IPU ⇄ Host
IPU ⇄ Remote buffer
IPU ⇄ Host & Remote buffer
3.13.9. General improvements and bug fixes
There is now a vertical splitter when comparing execution traces and program trees.
There is a link to the Getting Started video on the starting page.
Switching between the light and dark mode does not require a restart.
You only have to enter one password when opening reports on the same remote host.
When opening two reports to compare, there is now a button to copy the directory locations between source and target directories.
You can now move the graph stats box around and place it where you wish.
Menus no longer close immediately when an option is selected, allowing you to select many at once without having to re-open the menu.
The ‘Variables’ Graph type in the Memory Report prompts you to search for a variable by name.
The Summary page and recent reports list includes a timestamp indicating when the report was captured.
The Memory Report variables layout shows which are the interleaved & non-interleaved memory banks.
3.14. Version 2.3.2
15th March, 2021
3.14.1. Highlights
We have added a number of new features and fixes to this release of the PopVision™ Graph Analyser. The most notable new features are:
The new file format added in the Poplar 1.4 SDK release is now default resulting in at least a 70% reduction in file size
Enhanced debug information for PopART, TensorFlow
New operations report
3.14.2. Poplar
The following Poplar SDK 2.0 features can be used with Poplar Graph Analyser
In the last release we added a new Poplar report format, v3. The v3 format uses SQL rather than JSON and results in report file sizes that are at least 70% smaller. For the Poplar SDK 2.0 release this is now the default format, so you do not need to set the format explicitly.
A new Poplar engine option “profiler.replicaToProfile” allows you to indicate which replica you want to profile. If you have a replicated model, the profile information is duplicated for each replica. If you are only interested in the information from one replica then this option allows you to focus on just a single replica.
A new Poplar engine option “profiler.includeFlopEstimates” controls the generation of estimates for the number of floating point operation per compute set. These estimates can then be seen in the PopVision™ Graph Analyser Memory and Execution reports.
3.14.3. PopART and TensorFlow
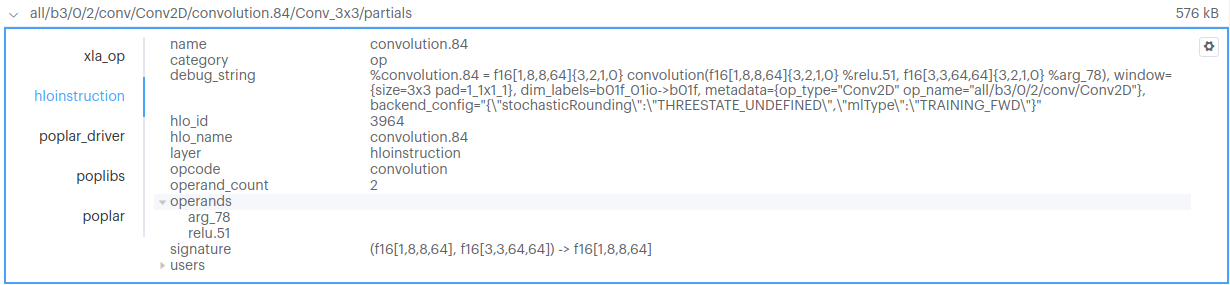
In the last release we added enhanced debug info to Poplar and PopLibs. For this release we have updated the Graphcore TensorFlow and PopART released to include enhanced debug information. For PopART you can see the information for the PopART Builder, ONNX Node and also the PopART IR Operation. For TensorFlow you can see the information for the XLA Op, HLO Op and Tensroflow Poplar plugin operation.
TensorFlow HLO Operation information
PopART ONNX Node information
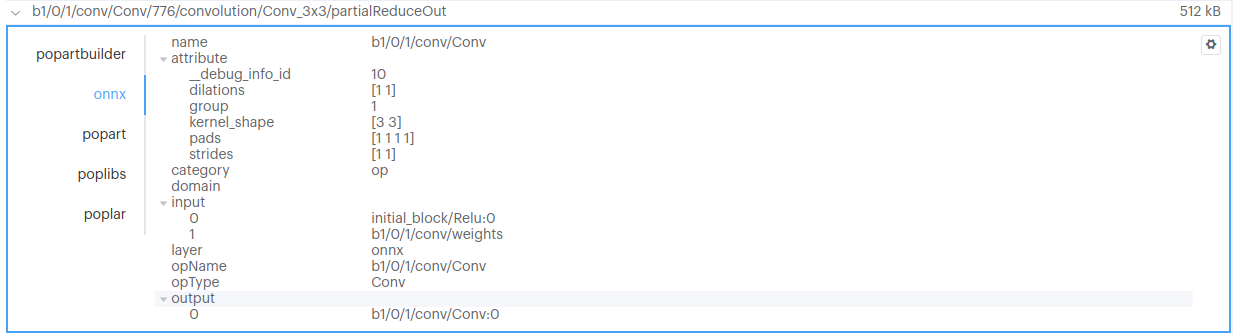
This enhanced debug information can be seen on the liveness report, program tree report and also the new operation summary report.
3.14.4. PopVision™ Graph Analyser
Added the option to increase or decrease the size of the font on the application and help using the Ctrl or Command key and then the +/- key. Options are also available from the menu.
All graphs now support WASD keyboard navigation for zooming and panning.
For all reports we have added the option to save the PopVision graphs to the clipboard in addition to the option to save to file.
When comparing reports we have added a popup to show full path name of the report files when hovering over the source/target graph keys.
3.14.5. Summary Report
The Summary Report information has been updated to show more information about replicas if you are looking at a replicated model.
3.14.6. Memory Report
If you select a variable on the memory layout to see the details, the category type is now a hyper link to the documentation to explain what the category means.
Also on the variables tab of the memory report a new option has been added to allow you to view the variables as a table to sort the variables by size
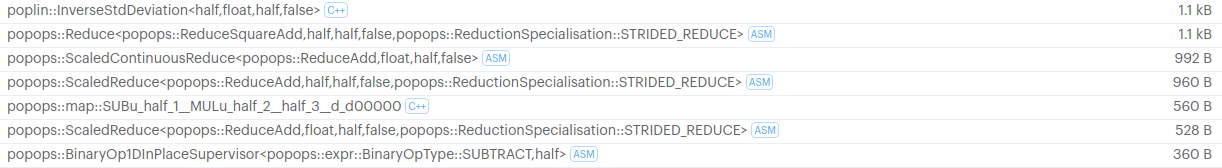
In all reports that contain vertex type information, they now also include a source indicator to show if the vertex is implemented in C++ or ASM. You can also filter vertices in the Memory Report based on their name and source
3.14.7. Liveness Report
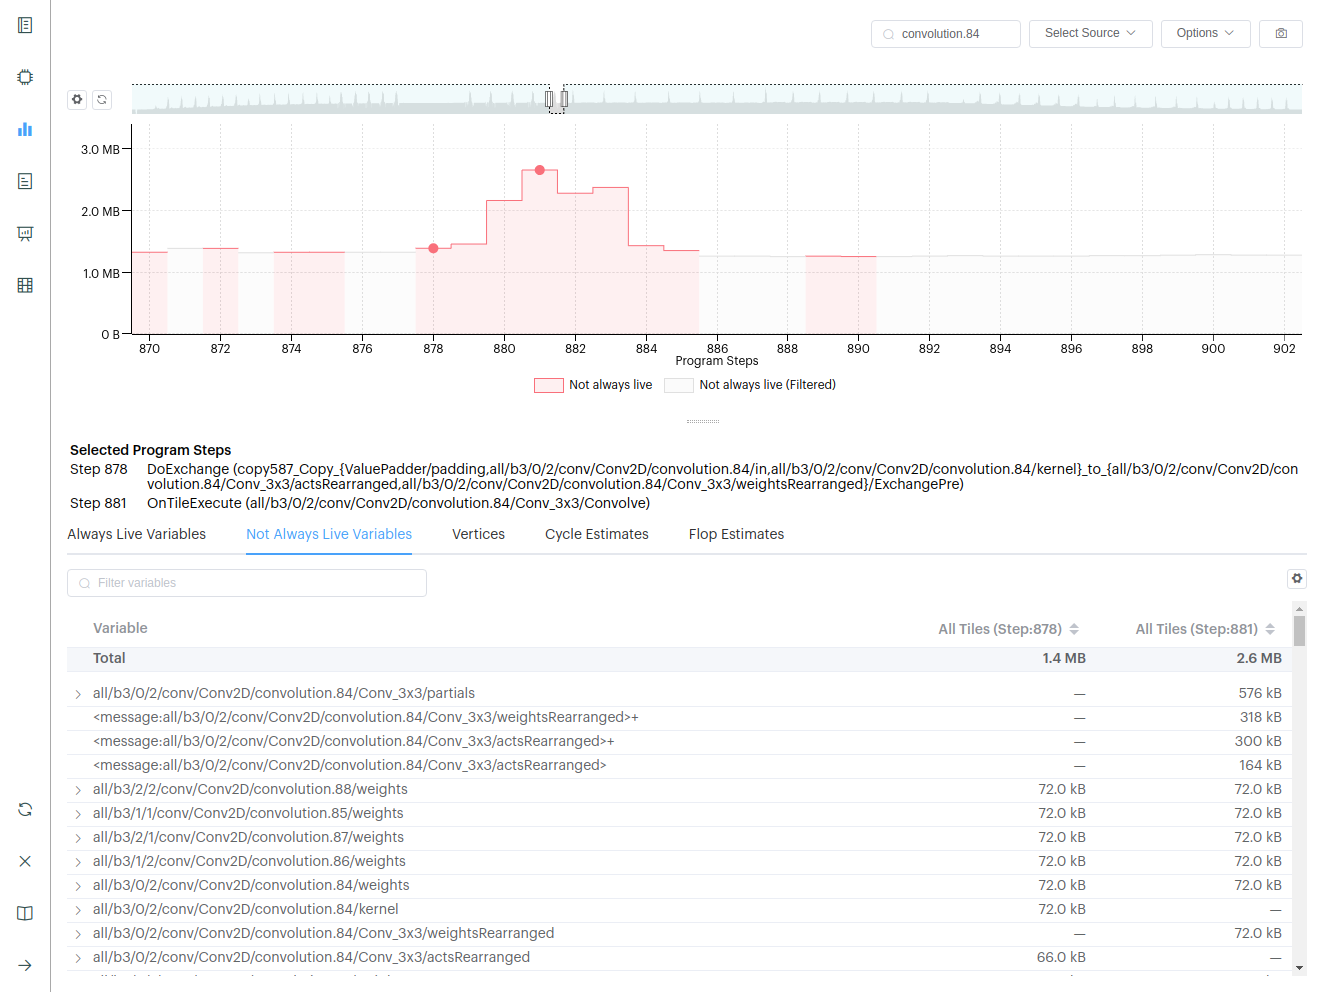
Added the option to select multiple points on the Liveness graph and compare the not-always-live-variables between two points. You can select multiple points by holding the Ctrl key down (Command for Mac).
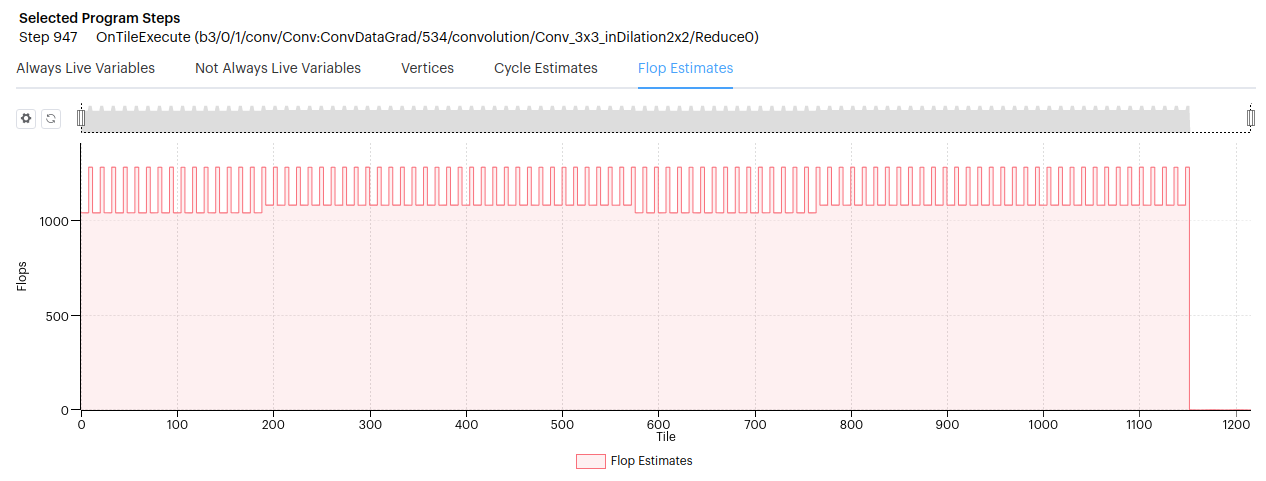
If FLOP estimates are reported by Poplar they will be shown on the Liveness graph when selecting a program step.
3.14.8. Operations Report
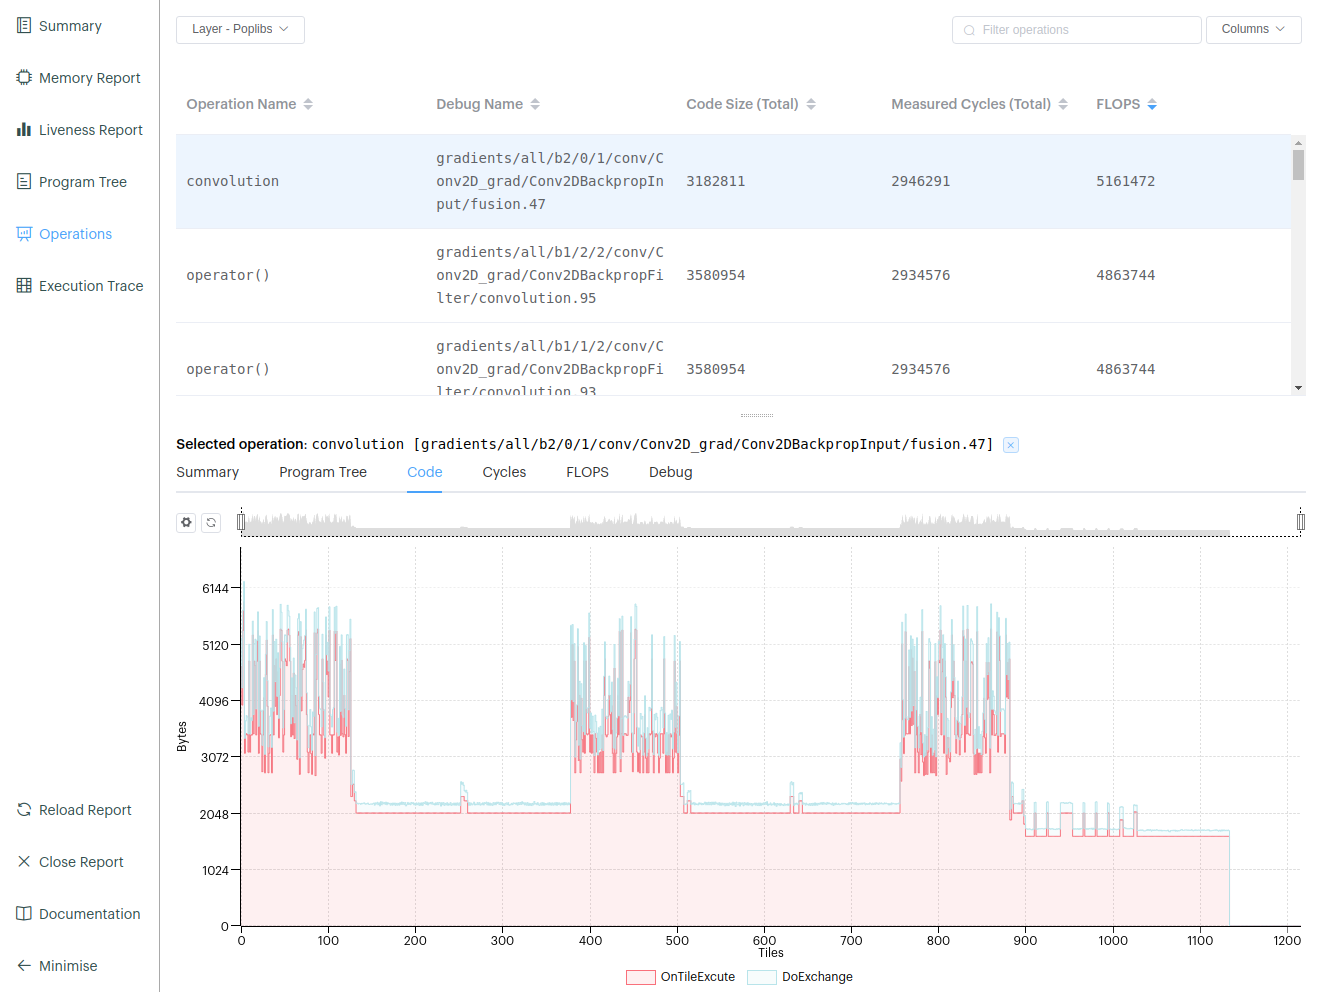
For this release we have added a new Operations report, which can show totals for code size, cycles and FLOPs per operation. This report relies on the enhanced debug information.
A table is shown which lists all the operations and totals. Which columns you want to see can be selected from the “Columns” dropdown. If you select one of the operations you will see details of that operation below.
Summary information
Expanded program tree of just the selected operation
Total code size per tile, broken down by program type
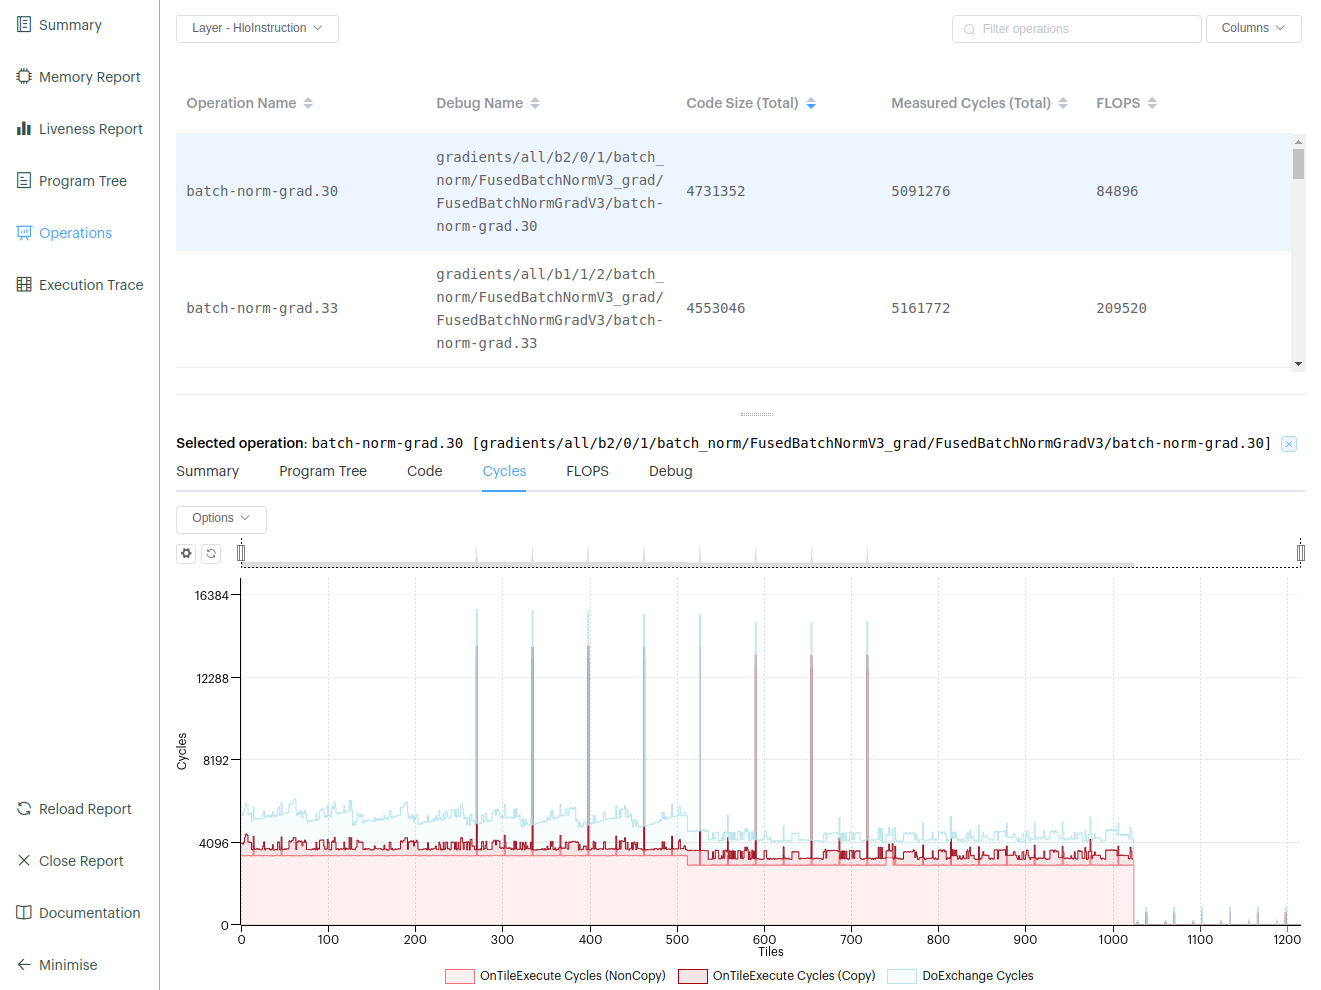
Total measured cycles per tile, broken down by program type
Total FLOPs
Debug information
By default, the PopLibs API call information is displayed. However if you select the layer from the drop-down in the top left corner you can see the same summation for PopART or TensorFlow operations.
Operations summary showing total code for the PopLibs convolution API call.
Operations summary showing the total cycles for a TensorFlow HLO (High-Level Operation) convolution instruction.
3.14.9. Execution Trace Report
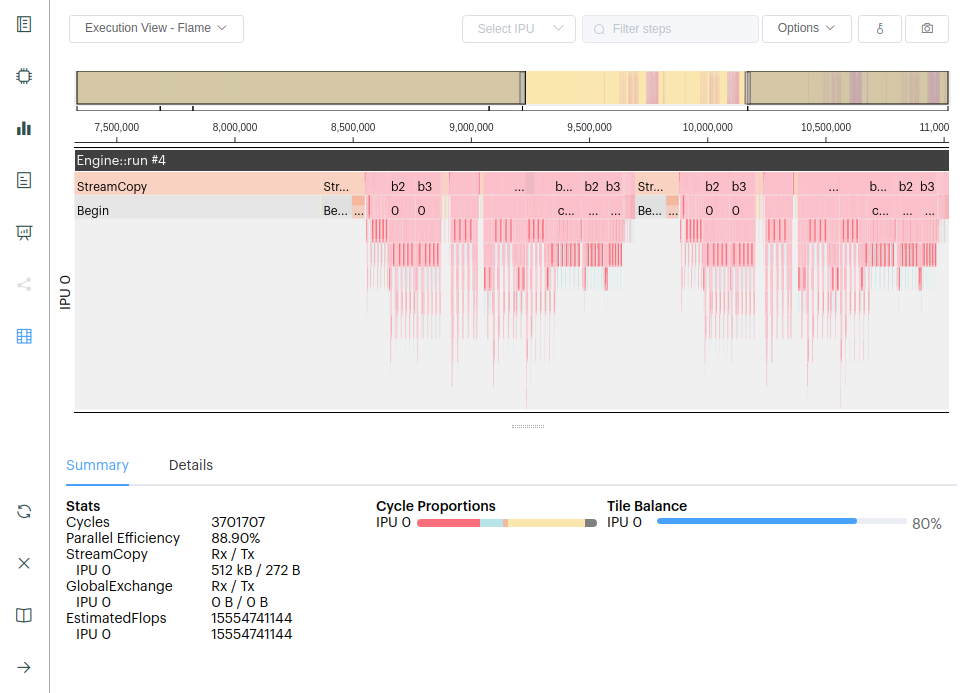
FLOPs are also shown on the Execution Trace Summary tab. The value shown for “Estimated FLOPs” and per IPU, is the sum of all FLOPs for the current Execution Trace view. As you zoom in the number of FLOPs will reduce. Note: you will need to have enabled the Poplar option ‘profiler.includeFlopEstimates’.
3.15. Version 2.2.5
7th December, 2020
3.15.1. Highlights
We have added a number of new features and fixes to this release of the PopVision™ Graph Analyser. The most notable new features are:
A new file format for the graph and execution profile, resulting in a 50% file size reduction.
Enhanced PopLibs debug information.
3.15.2. Poplar
A new profile format has been added to Poplar that significantly reduces the size of the report files and improves the PopVision Graph Analyser loading times. The new format can be enabled using:
''POPLAR_ENGINE_OPTIONS={"profile.format": "v3"}''When this option is selected the
graph.json/cborandexecution.json/cborare replaced with a singleprofile.pop. In a future release, we will make the v3 format the default.A new
POPLAR_ENGINE_OPTIONhas been added (when using the v3 profile.format) to specify when the execution information is written to file. If the “autoReport.streamAtEachRun” option is set to true, then execution information will be written to file at the end of each engine run. This has been introduced to resolve issues in TensorFlow that resulted in the execution not being output.
3.15.3. Memory Report
A new “By Data Type” memory category has been added to the memory details tab.
A new “Exchanges” tab has been added which shows the code size of exchanges.
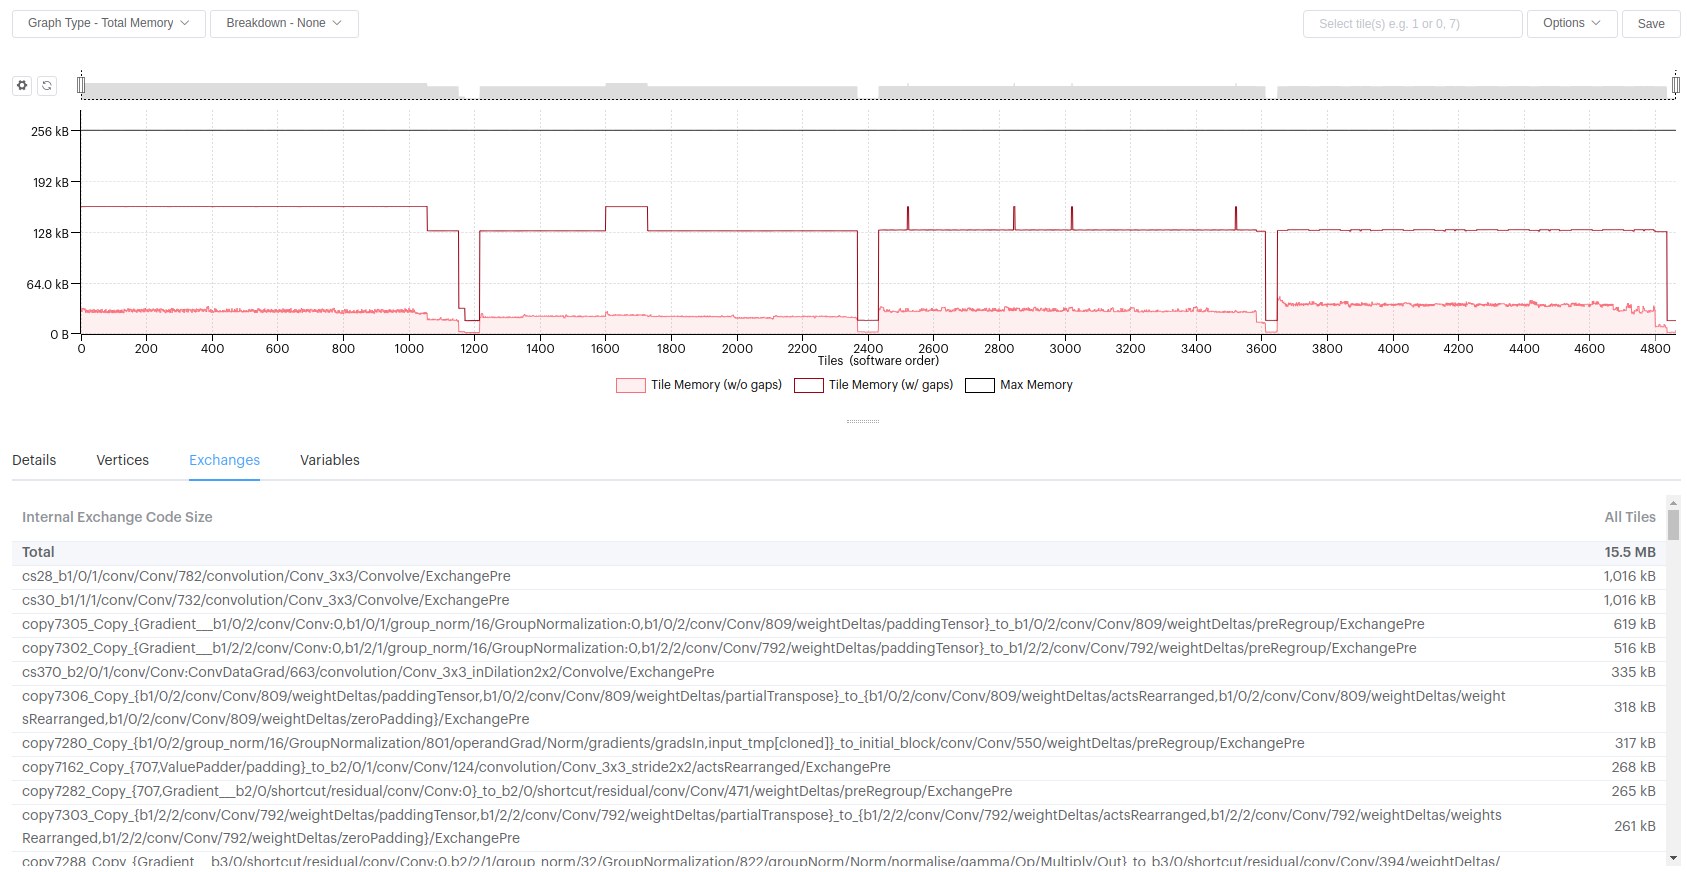
If you are just viewing the
archive.afile, you can now select a tile to see limited details about it.Added support for comparing just the
archive.afiles.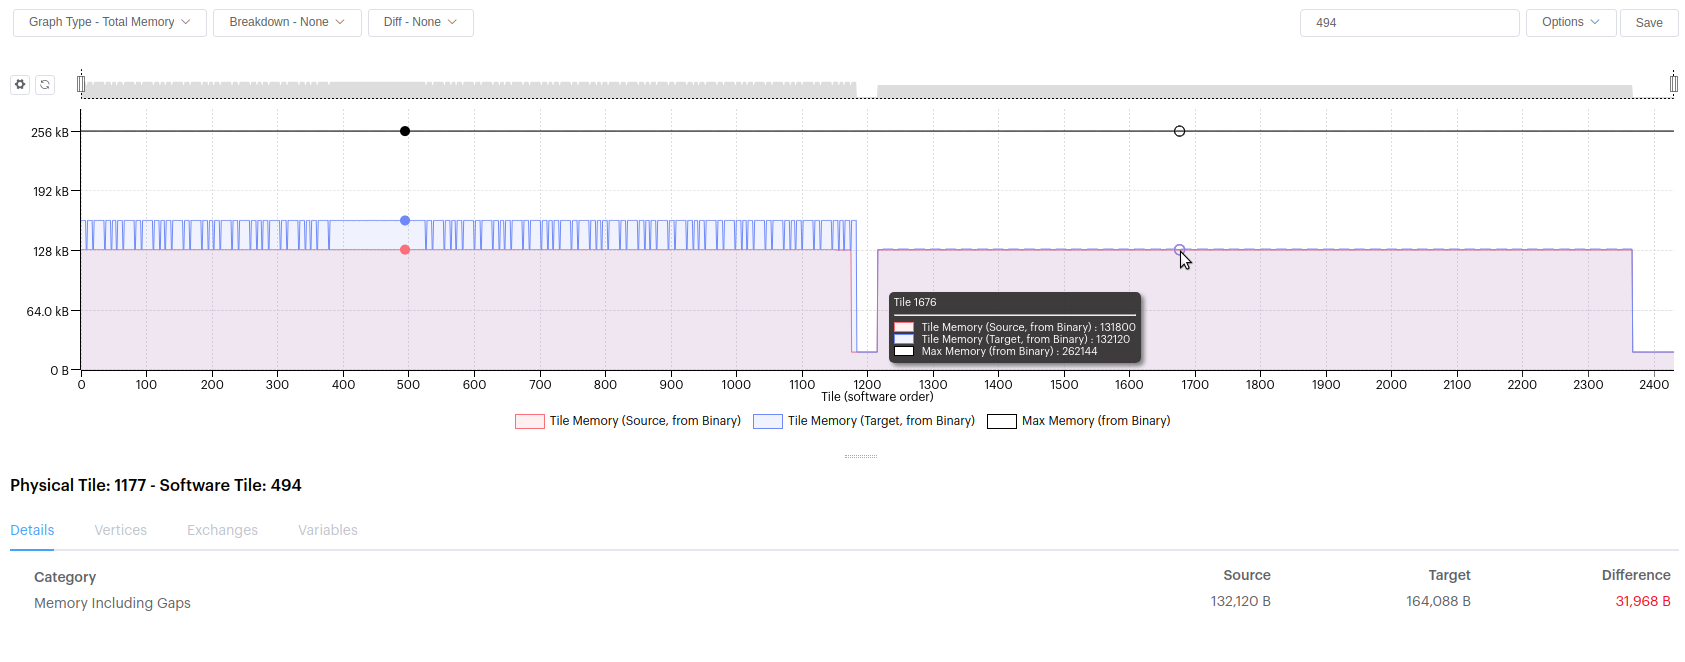
3.15.4. Liveness Report
The debug information shown for a variable has been updated to show PopLibs information. For each variable that has debug information, you can now see the PopLibs API that created it, its arguments and its outputs.
3.15.5. Program Tree
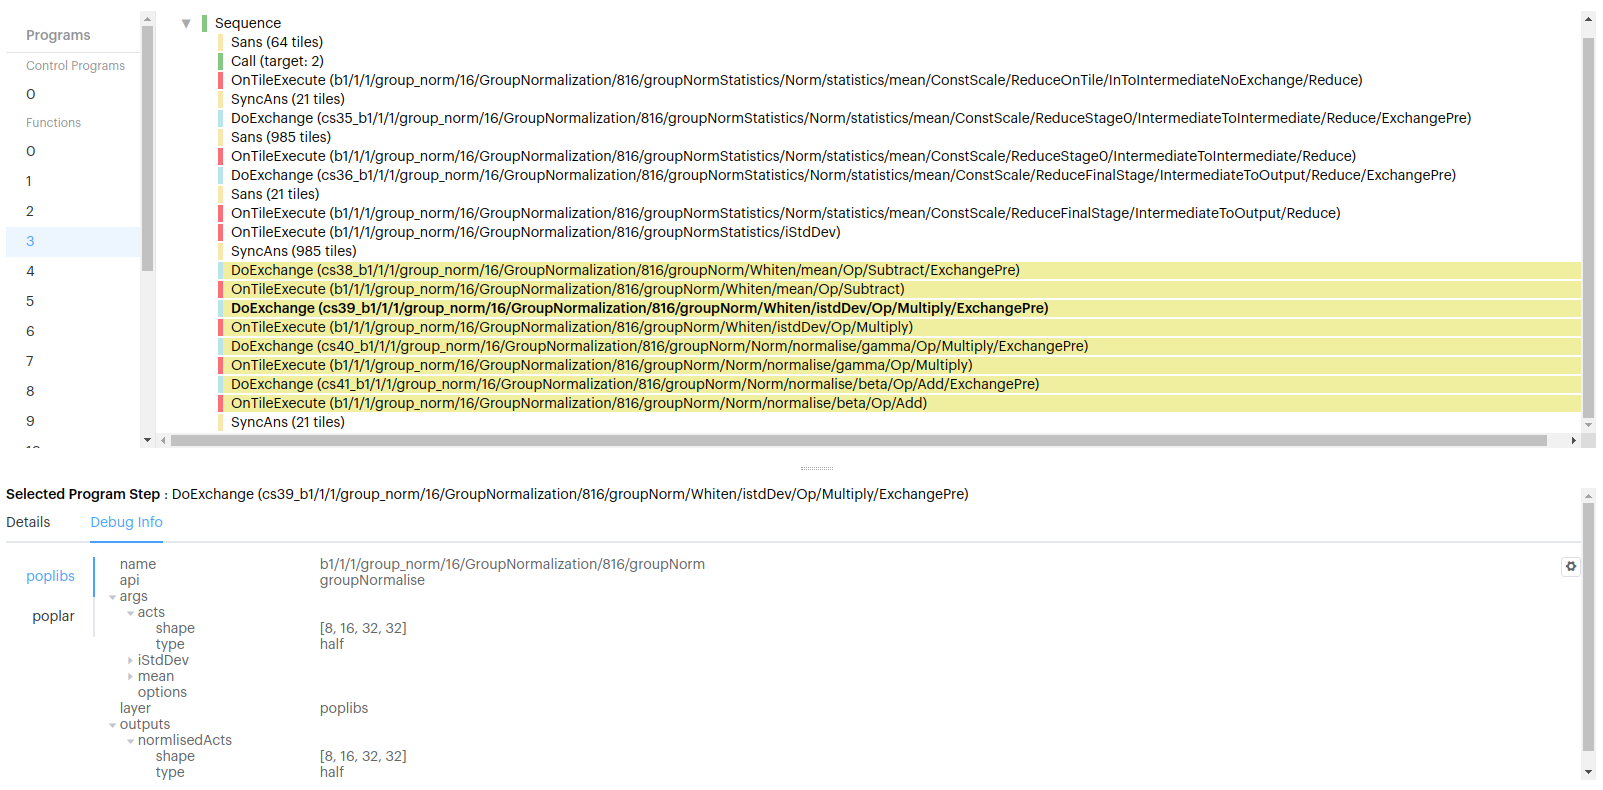
The program tree report has been updated to now show details when you select a step. The details are the same as you will see when you select a step in the execution trace, plus some vertex information.
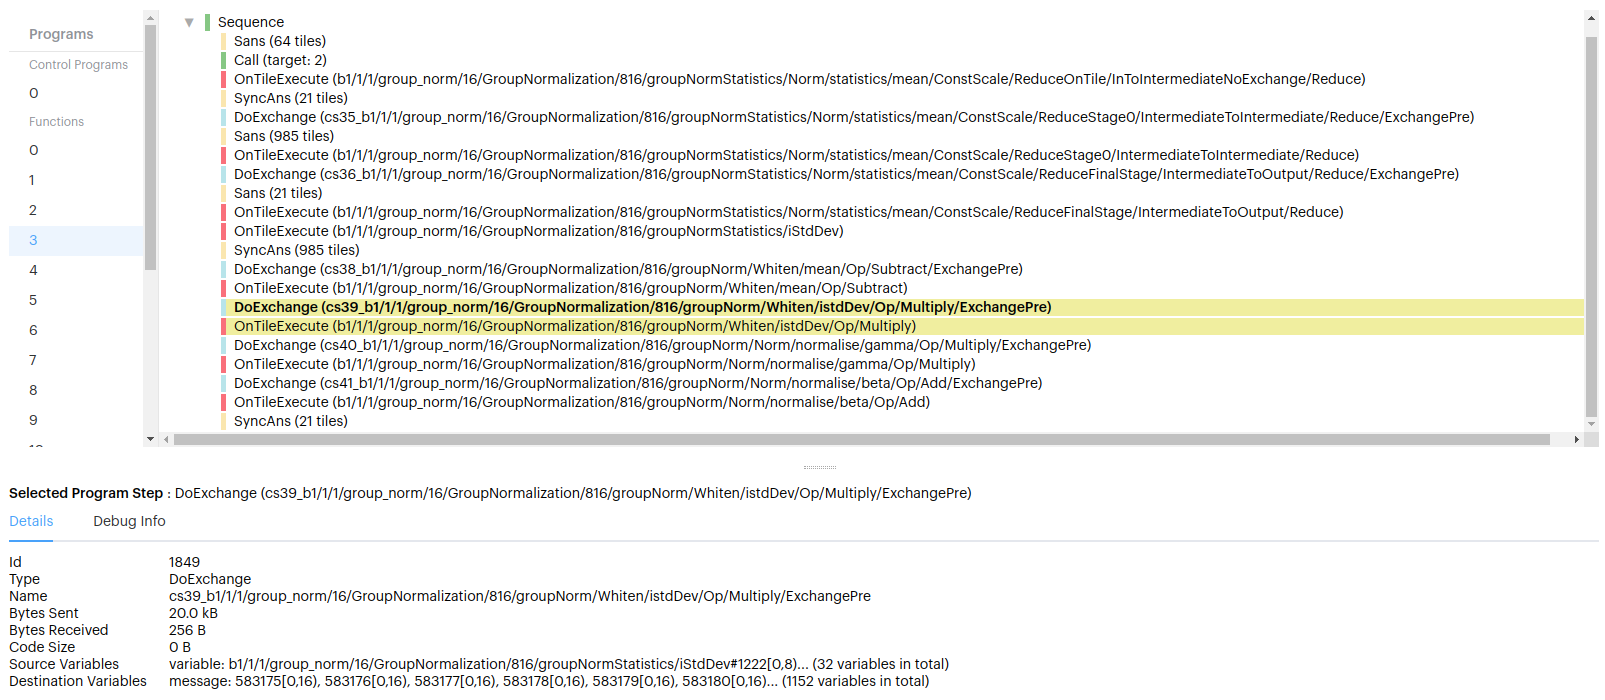
Enhanced debug information has been added to program steps. When you select a program step you can see the Poplar and PopLibs debug debug information. The PopLibs debug information shows which PopLibs API created that program step, its arguments and its outputs.
Selecting the PopLibs debug information now highlights all the program steps that where created for that PopLibs API call.
3.16. Version 2.1.3
30th September, 2020
3.16.1. Highlights
We have added a large number of new features and fixes to this release of the PopVision™ Graph Analyser. The most notable new features are:
Support for Mk2 IPU
New tile map memory plot, showing a graphical representation of tile memory usage overlaid on an IPU schematic drawing
Visualization of overlapped IO
3.16.2. Summary Report
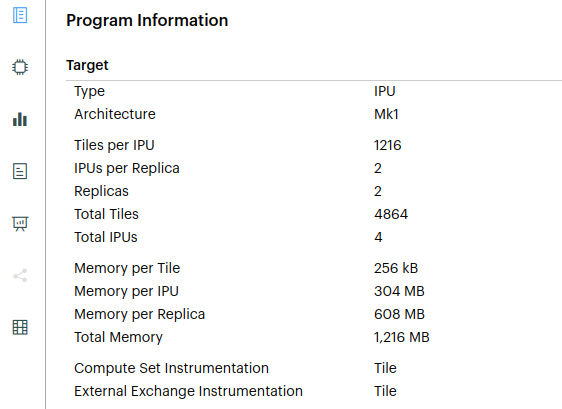
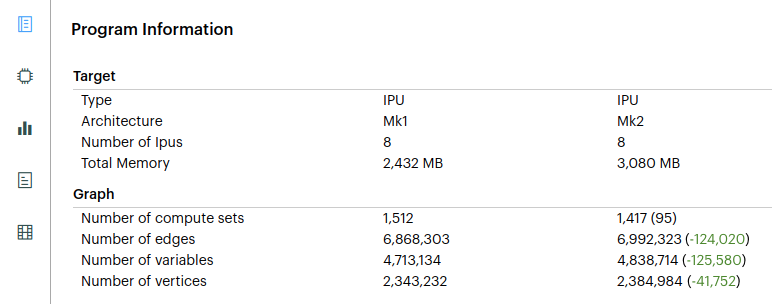
The summary page now shows if the report was for a ‘Mk1’ or ‘Mk2’ IPU. Here the compare reports summary page shows a report generated on Mk1 vs Mk2:
Added support for replicated graphs. The number of replicas is shown on the summary page if greater than one.
Changed the visualization of deltas on the Summary report to match the Memory report. Negative deltas are show in green and positive deltas are show in red.
When comparing reports, you can now see the full paths for each report on the Summary screen.
Added support for booleans in app.json and framework.json.
3.16.3. Memory Report
Added a new memory view: Tile Map. The new tile map Memory Report can be opened by selecting it from the Graph Type drop-down menu. The tile map shows a diagram of an IPU and colors each tile based on the amount of memory it requires:
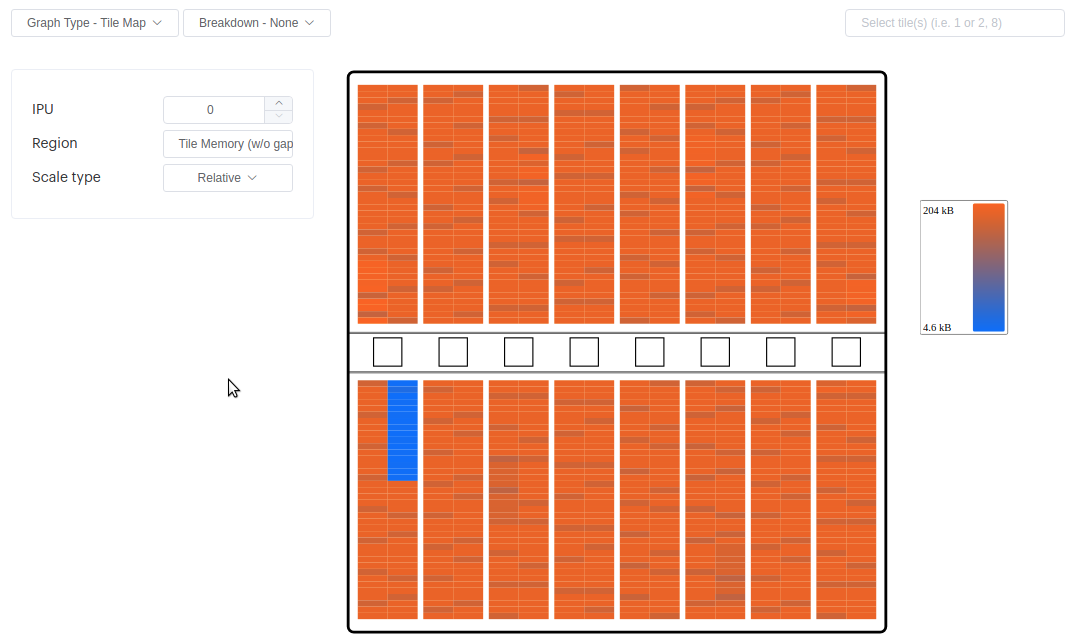 The intention of this memory plot is to allow you to see the association between memory useage and the physical position of the tile.
You can select to see total memory (with/without gaps) or the region interleaved/non interleaved (with/without gaps).
There are display options that allow you to see the absolute and relative measurements, as well as a ranked display.
The tile map plot also includes a tooltip and also allows you to select tiles and see the details below. Multiple tiles can be selected while holding the Ctrl key down (Command for Mac). When out or memory, the colors are scaled, not just to max memory.
The tile map also supports comparing reports:
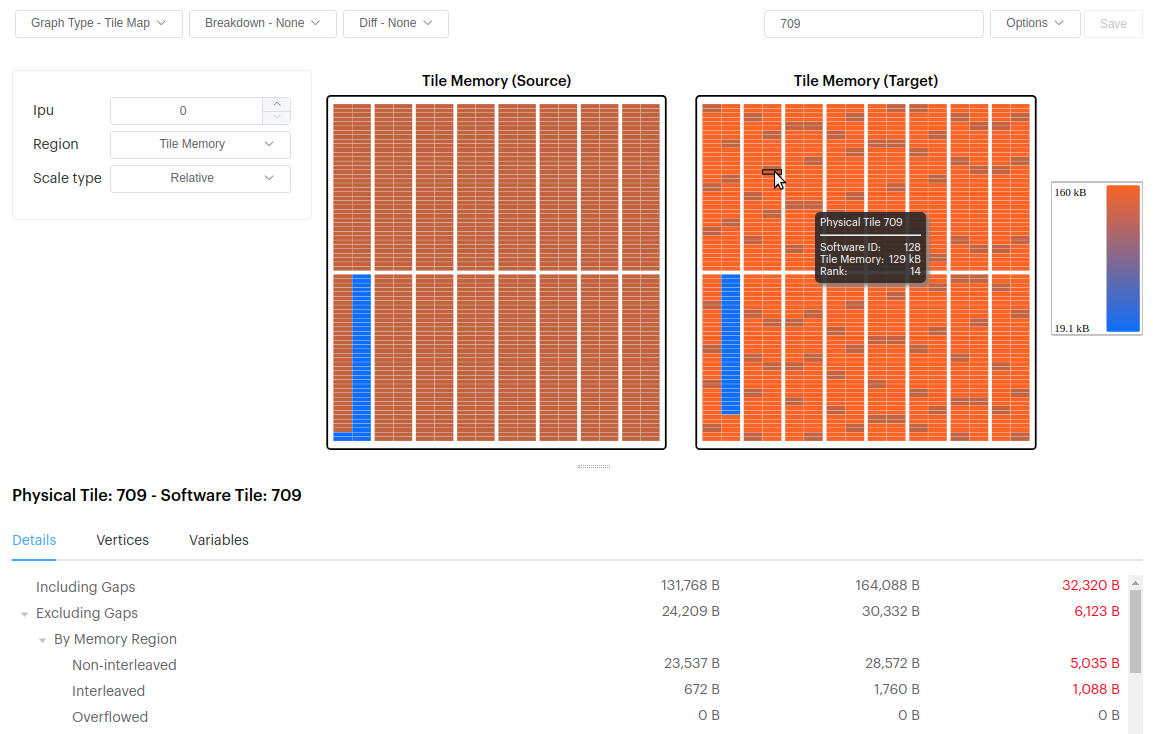 You can also display the delta & difference between them:
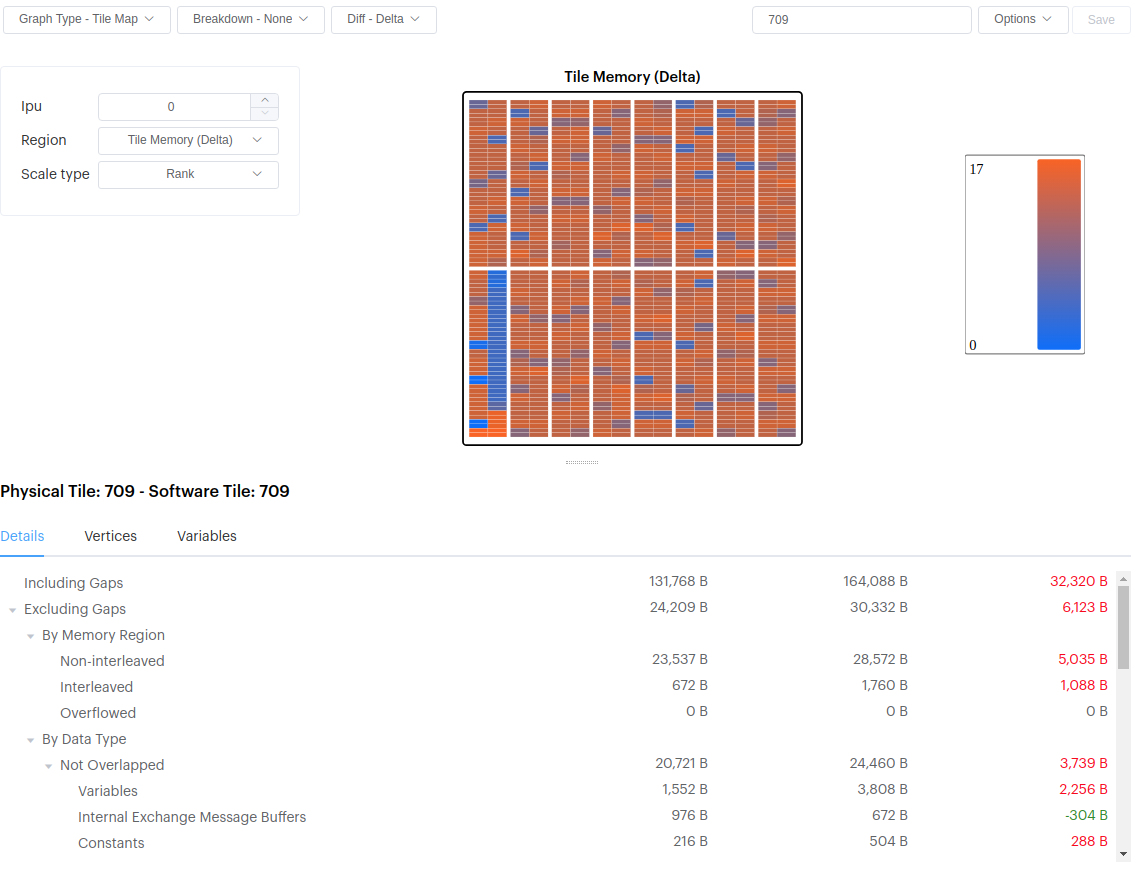
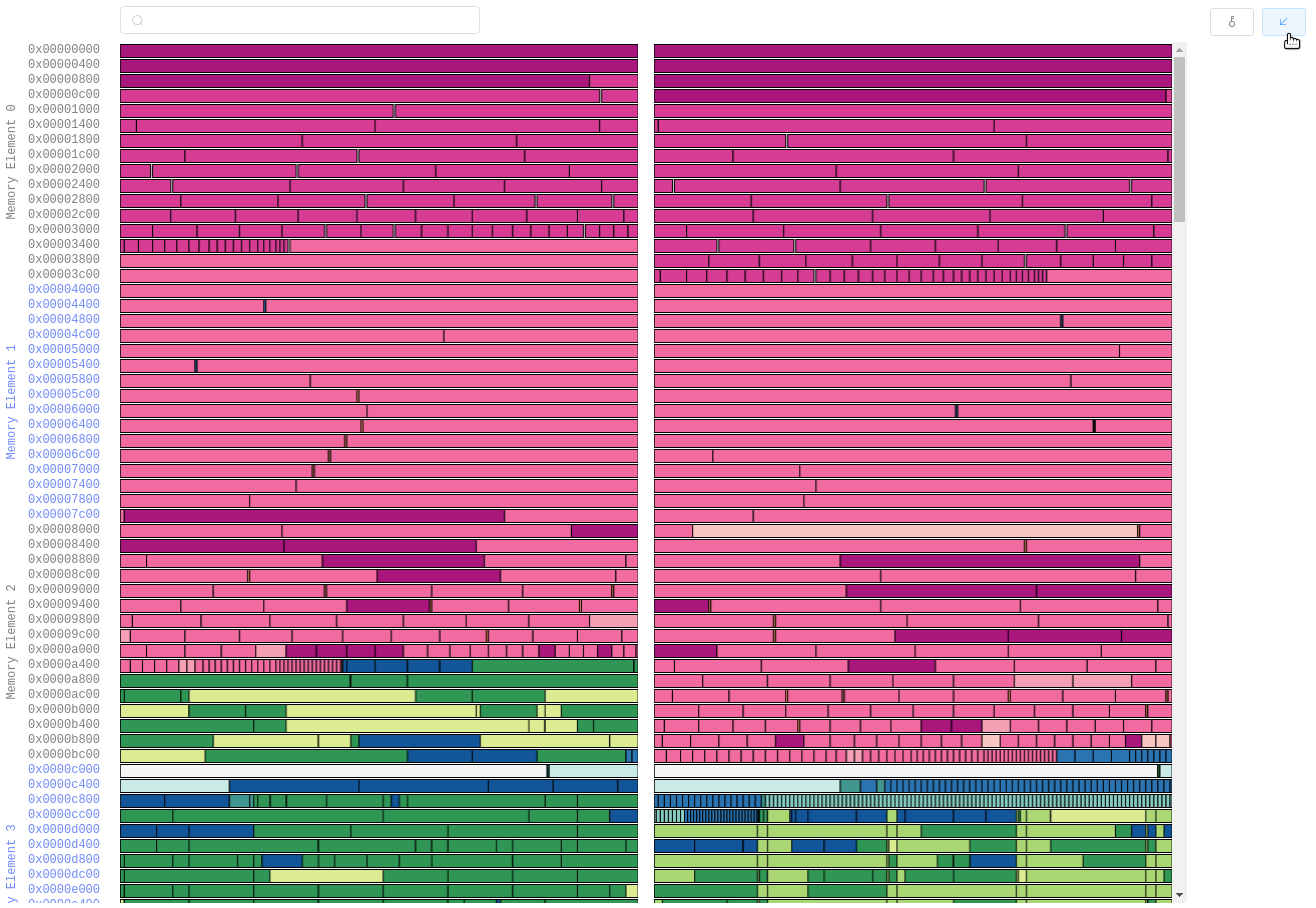
Added a new option to enlarge the variable memory layout to full-screen:
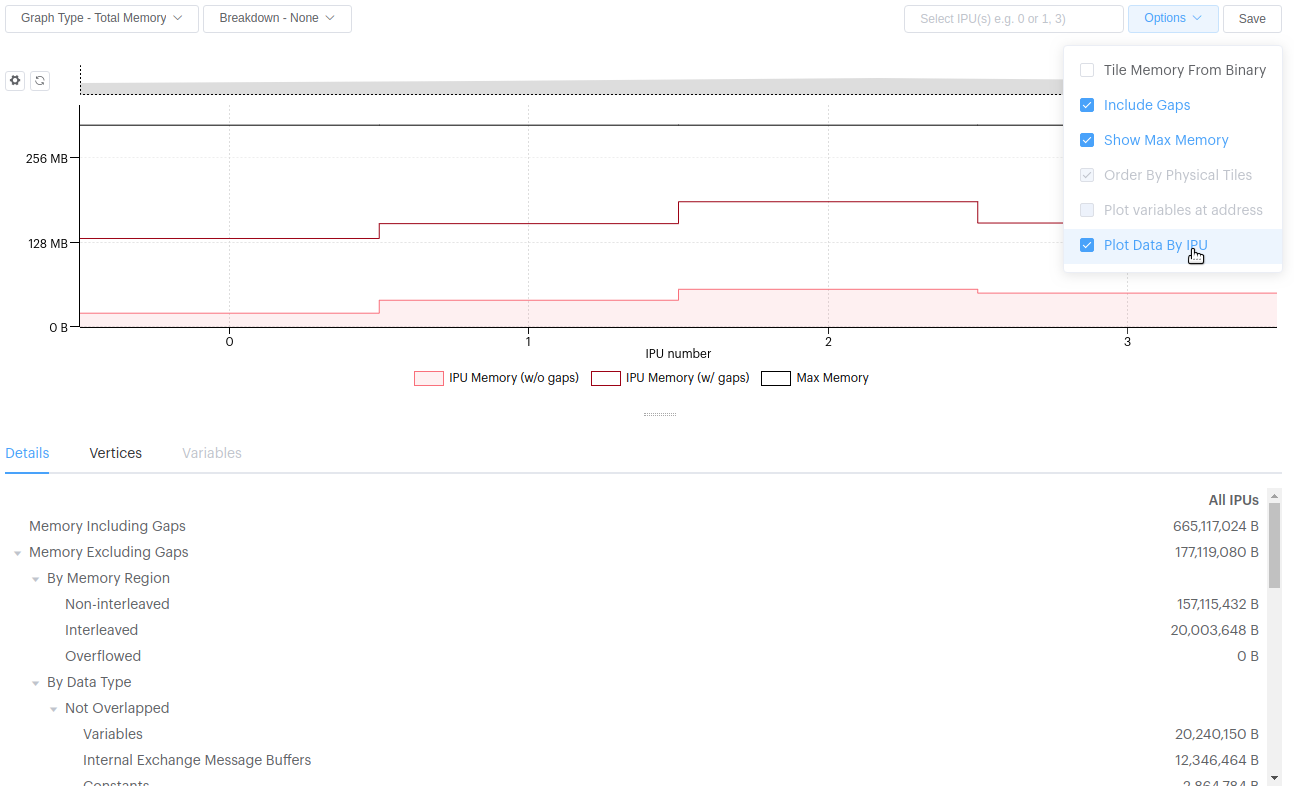
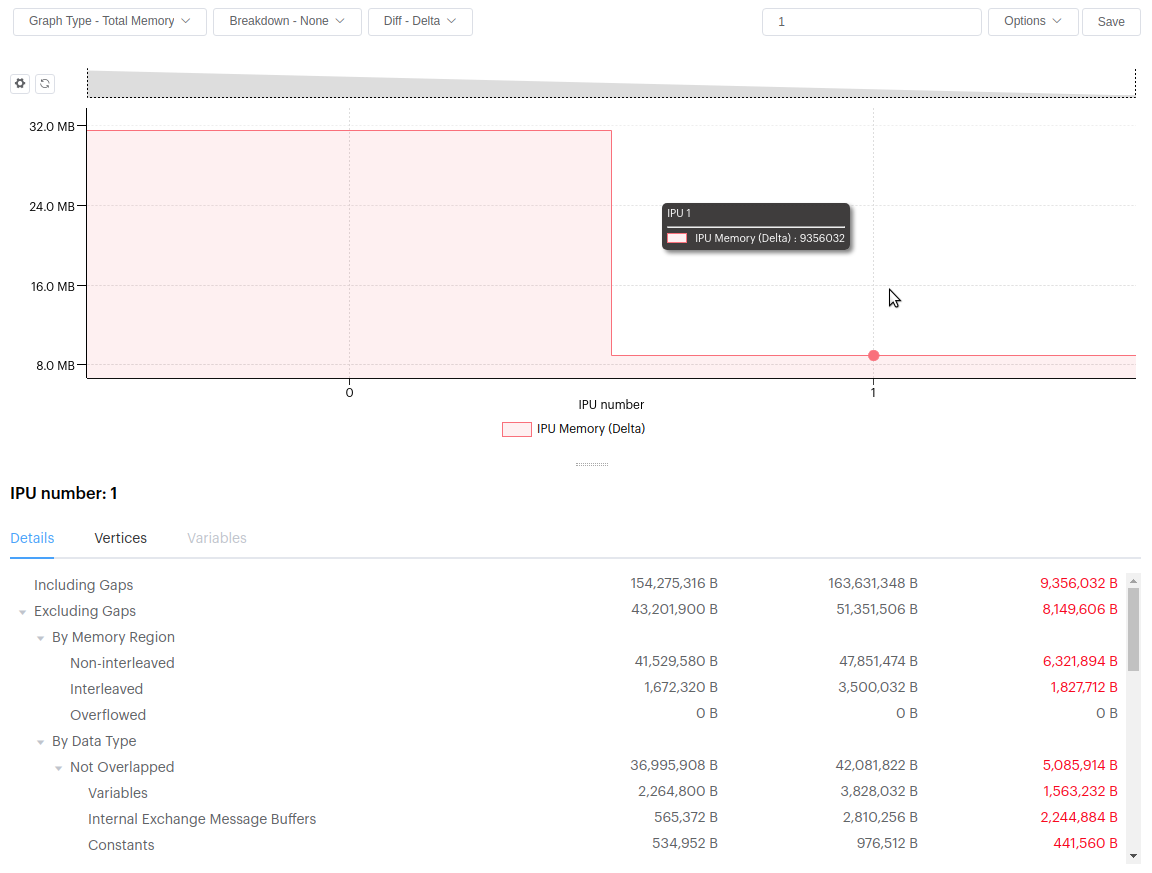
Added the option to show memory usage by IPU:
You can compare multiple IPUs by shift-clicking them.
The memory-by-IPU option allows you to see the total memory required for each vertex type, so you can compare across multiple IPUs:
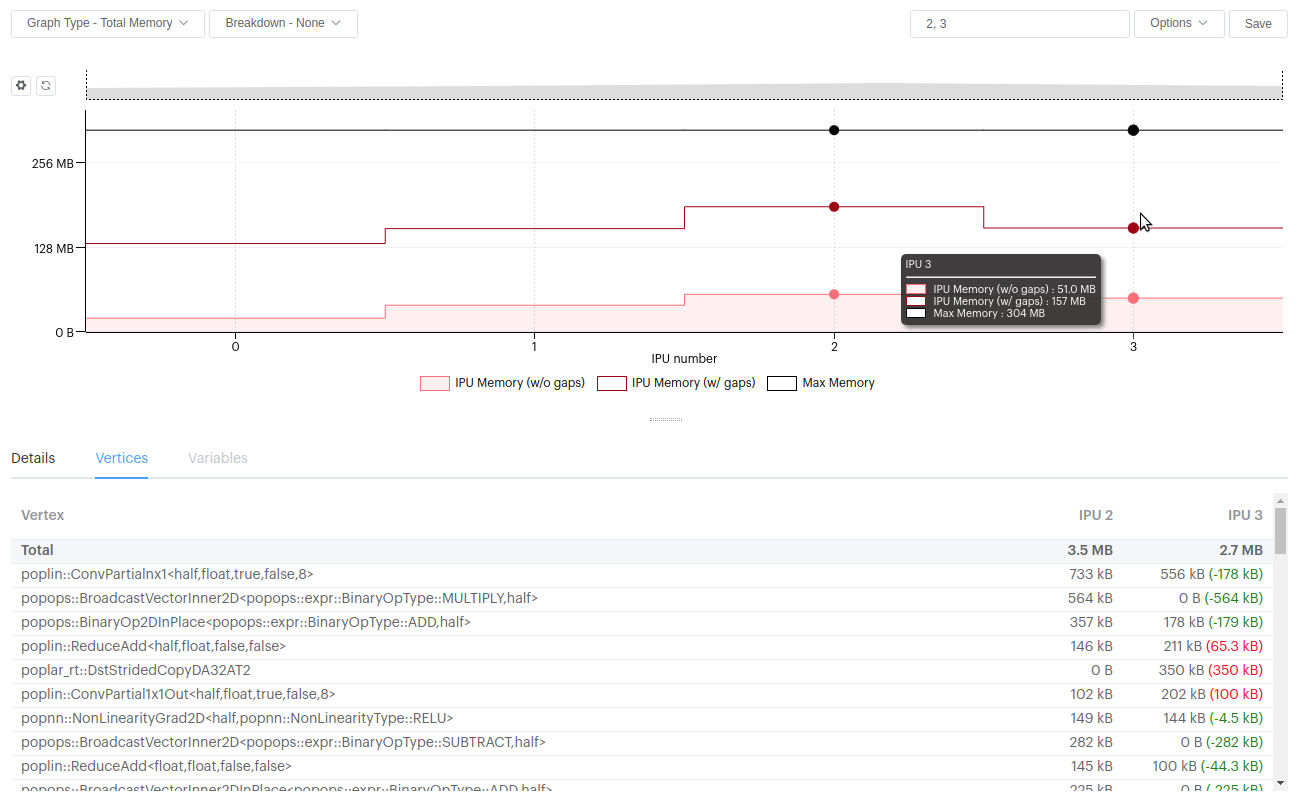
Displaying memory by IPU now is also supported when comparing reports. This is useful when looking at reports with many IPUs:
3.16.4. Liveness Report
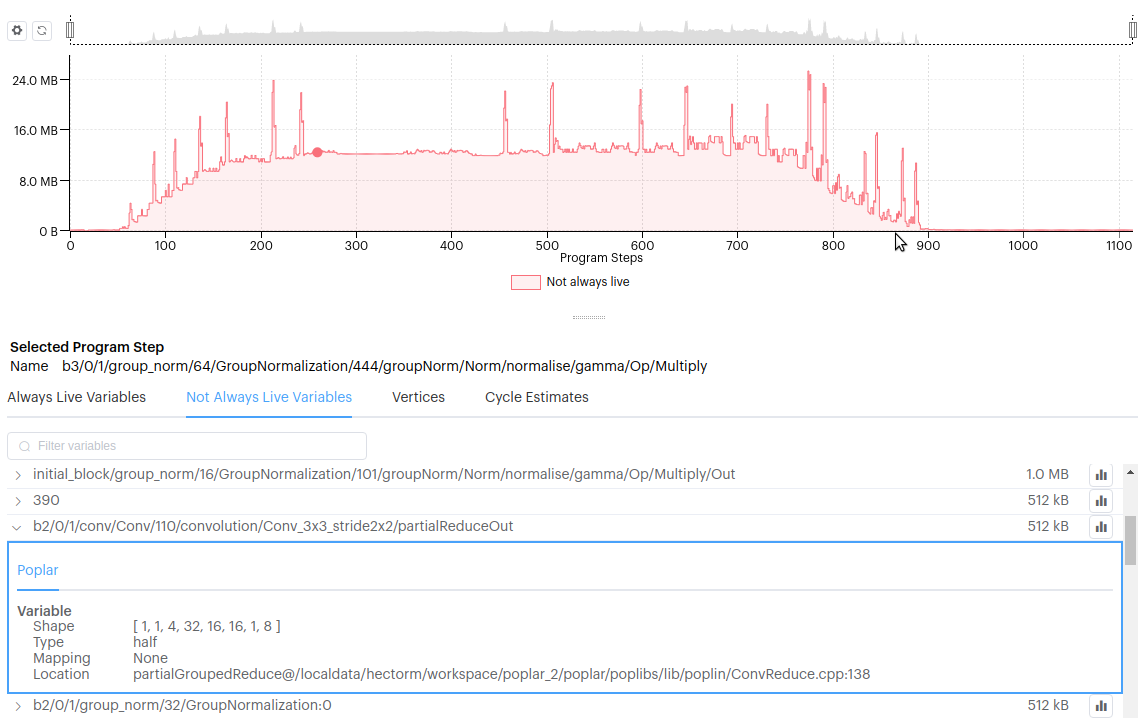
Enhanced debug information can be viewed on the liveness report (if a debug.cbor file has been generated). For variables that have the enhanced information you will see an expander. Currently this shows the variable shape, type and the location in code where it was created.
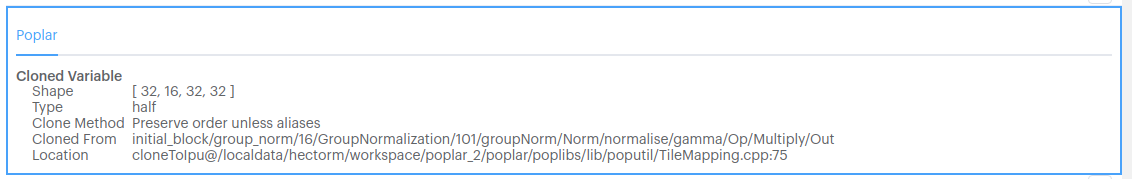
For a cloned variable it shows which variable it was cloned from:
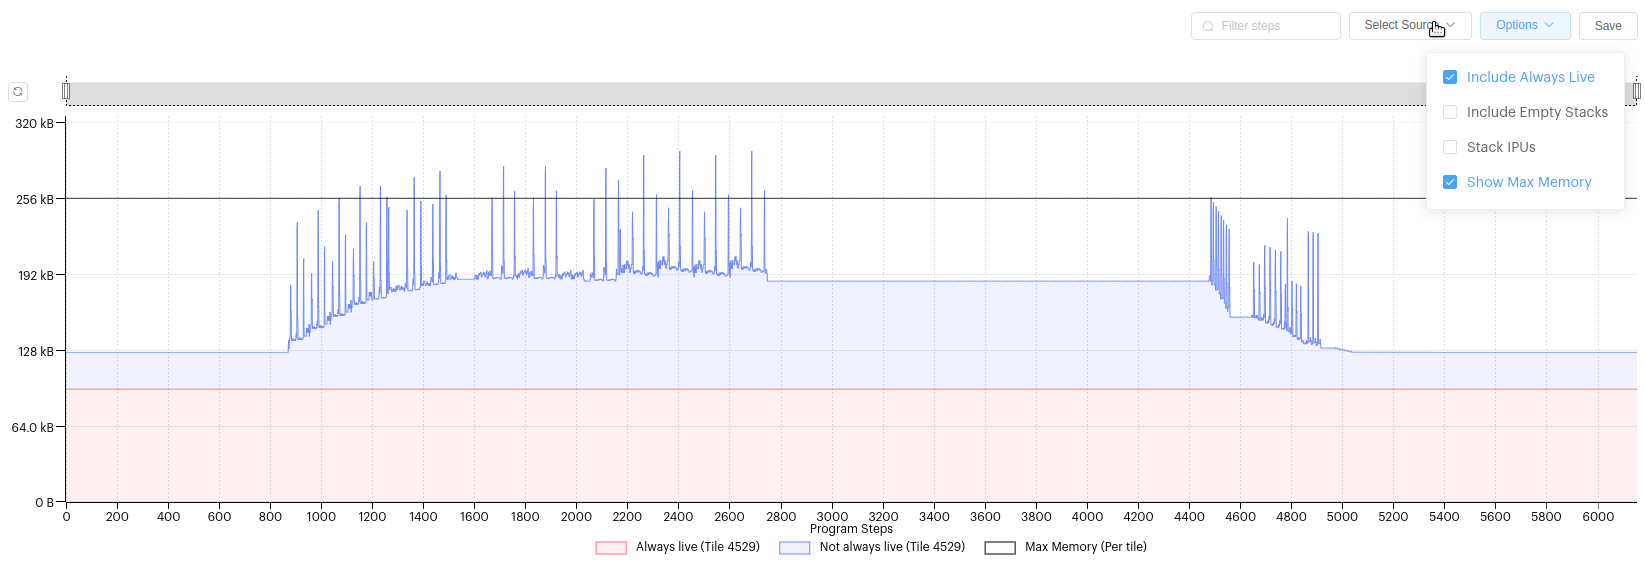
Added a new option to the Liveness graph, when always-live variables are being displayed. This draws a max memory line for a tile, an IPU or all tiles, depending on whether you are viewing all tiles, an IPU or tile liveness.
As you can see here, this allows you to see which steps in your program are exceeding the maximum memory:
Fixed liveness graph to correctly stack always-live and not-always-live for each IPU, but then not stack IPUs.
Changed “Selected Stack” to “Selected Program Step”.
3.16.5. Execution Trace
Selecting a BSP step now draws a blue outline around it. You can also see the cycles-per-tile graph for all steps. If available, both cycle estimates and cycles for OnTileExecute are displayed (in this case a StreamCopy):
You can see cycles for exchanges as well as the TX/RX for each tile:
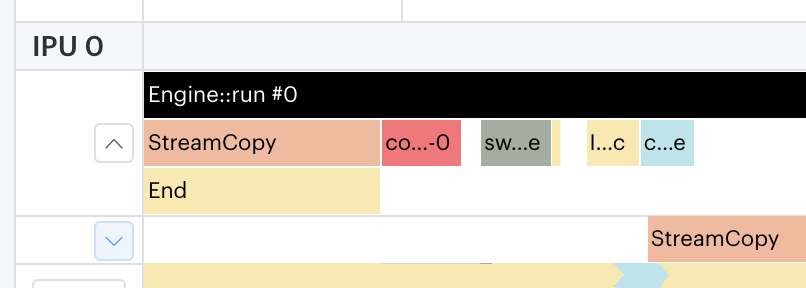
To support overlapped IO, a stream copy step has been broken down into separate phases (Begin/Copy/End). When you view the execution trace in flame mode, the StreamCopy Begin/Copy/End phases are grouped together:
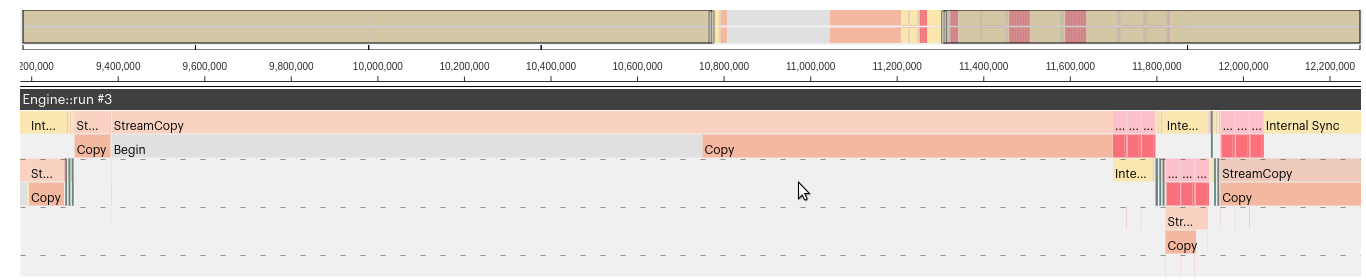
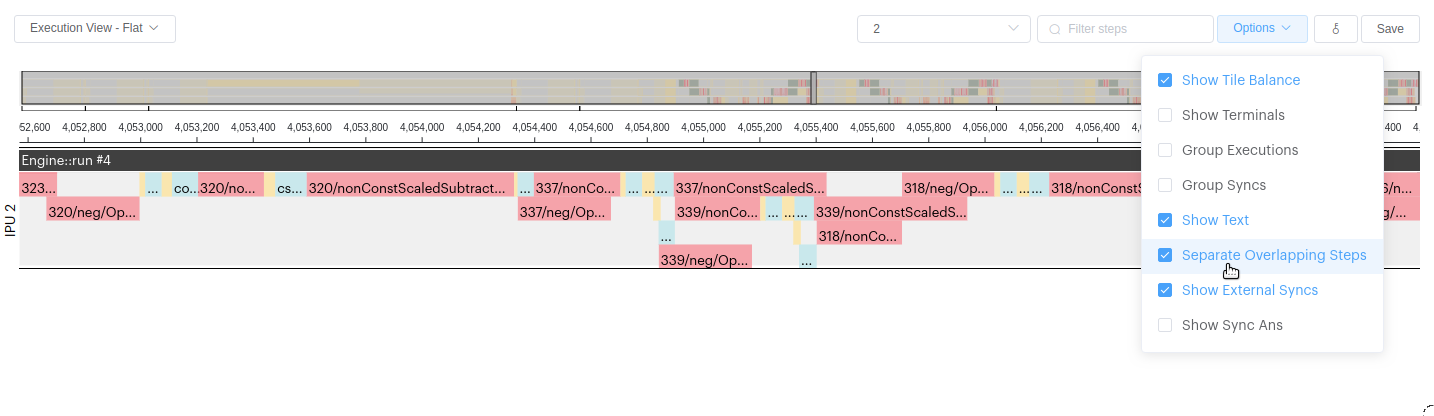
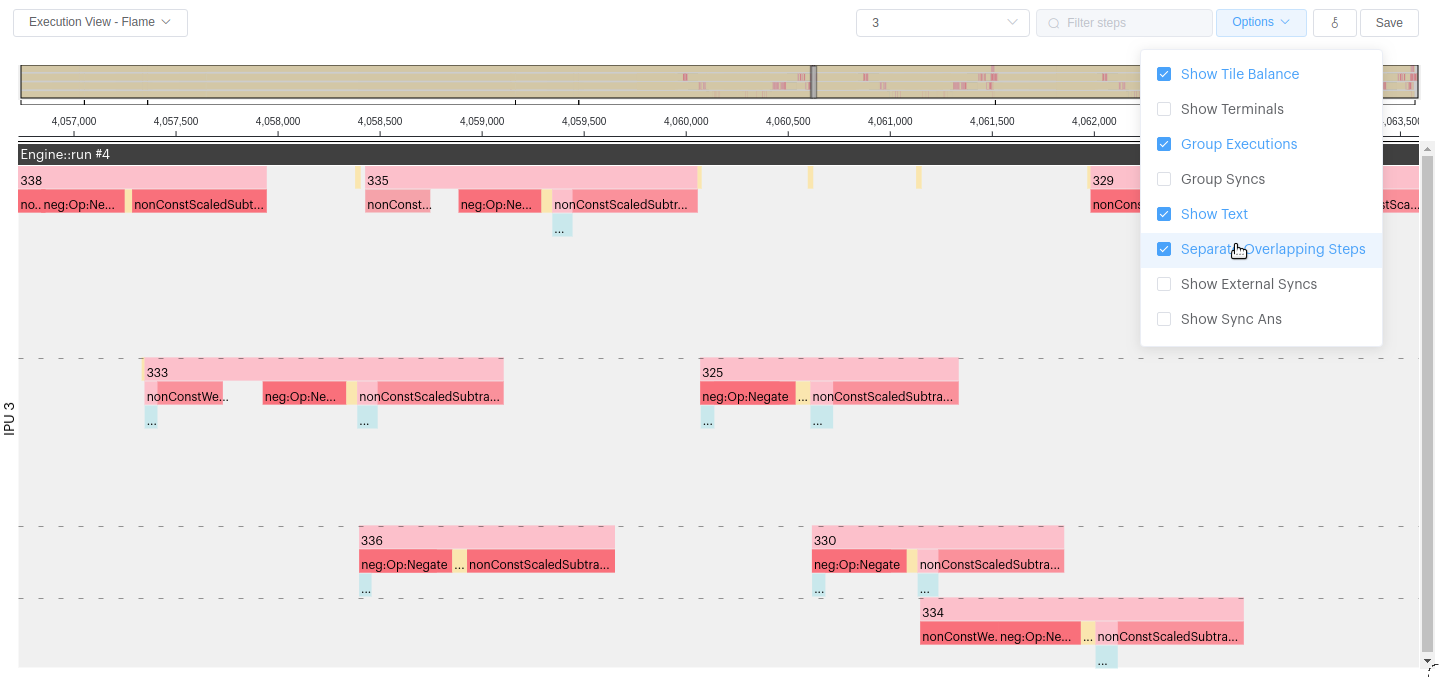
To support overlapped IO, a new option has been added to visualize program steps that execute concurrently. This new option draws overlapping program steps on different ‘levels’:
You can now see when stream copies are run in parallel with on-tile compute steps.
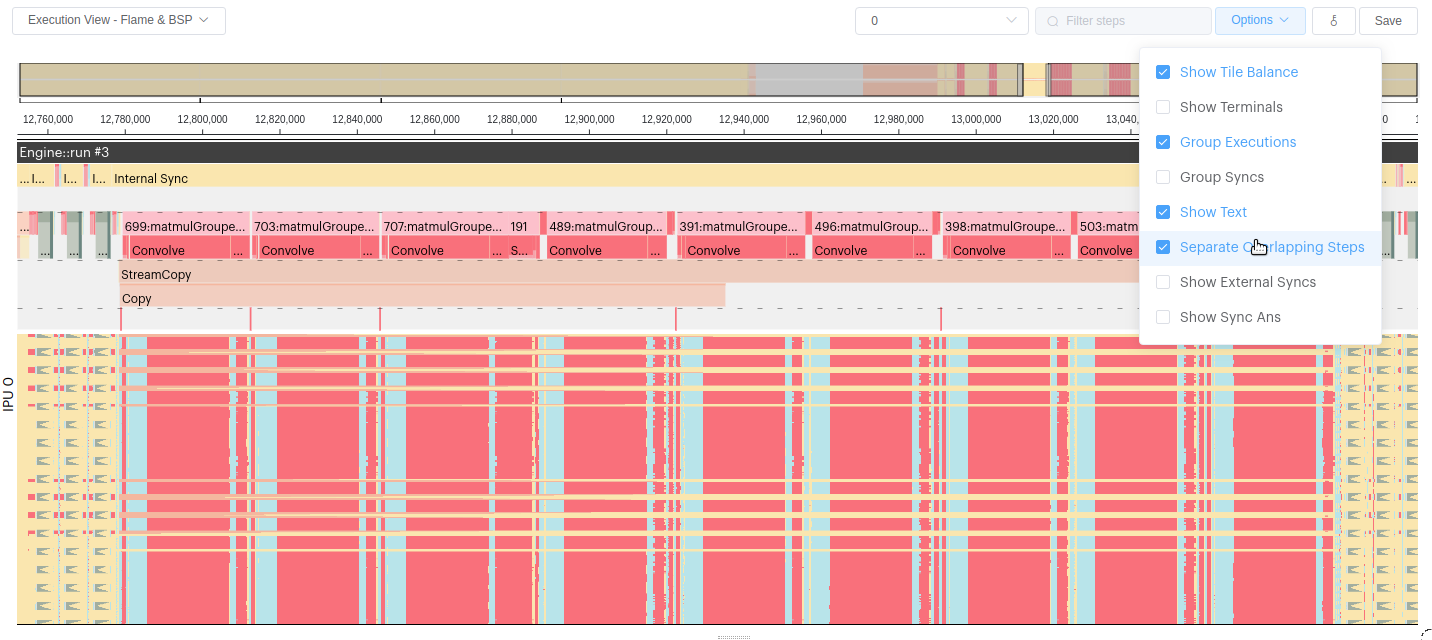
This also supported on the flame graphs where we group those overlapped program steps together and show overlapping section of the graph. Here you can see multiple weight updates occuring in parallel on different tiles:
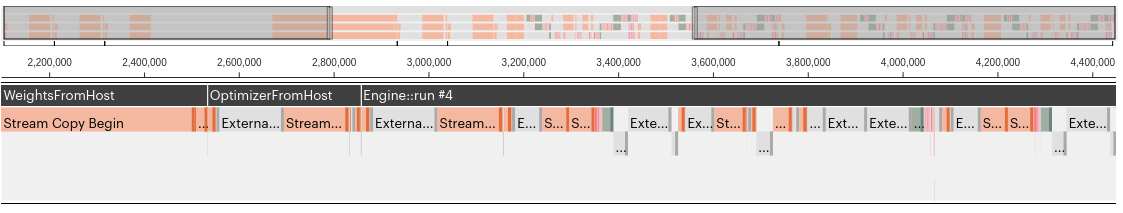
The execution trace now shows the calls to Poplar::Engine::run overlaid on the execution trace. This is useful to see the different phases of execution of a model. Poplar and PopART have been updated to pass a debug string to each Poplar::Engine::run to identify why the run is being called. PopART has also been modified to allow you to set the debug name when you call Session::run.
Here you can see the “Epoch 0 step 0” comes from a modified version of the resnet public examples. You can double click on a ‘dark grey’ bar and it will expand to the full width.
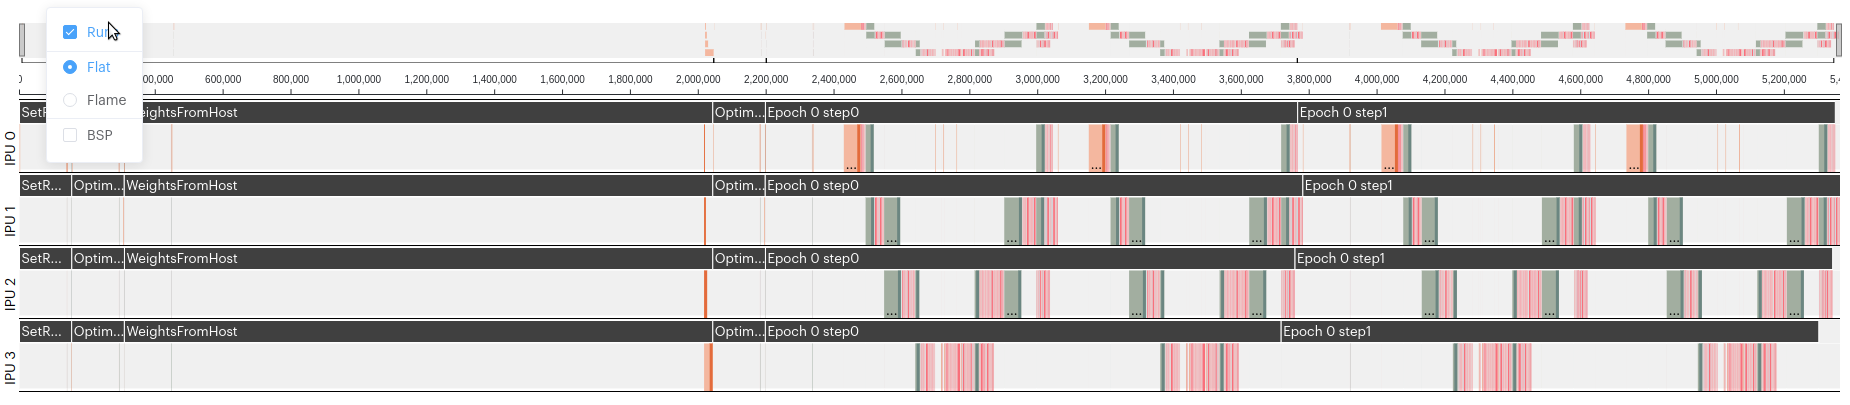
These program intervals are now shown in the mini map. If you hover you mouse over the ‘U’-shaped bars below the mini map, they are highlighted. Double-click them to expand the execution trace to that run.
You can see the number of cycles for a run, when you double click on a run, in the summary at the bottom.
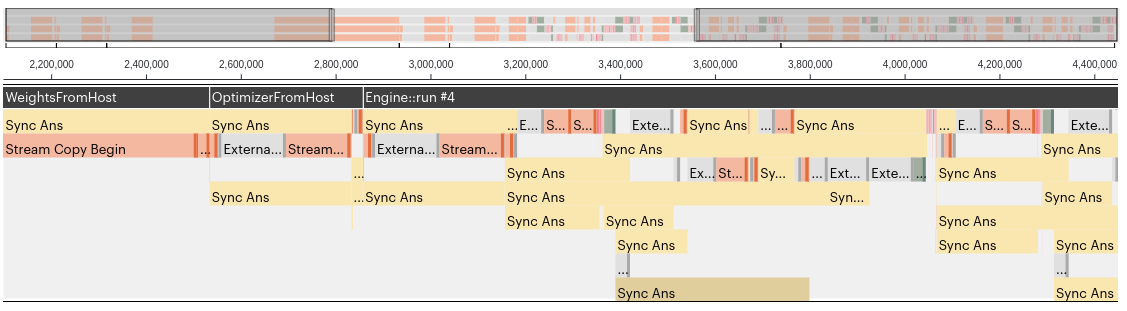
Added support for displaying SyncAns steps on the execution trace. These can be hidden from the options menu. Here you see the report with and without SyncAns. Notice the cycle proportions have change to reflect the SyncAns.
The calculation of cycle proportions has been modified to include tile balance so as to not show ‘”>”’ 100%.
Fixed the cycles graph for StreamCopy on the execution trace.
Fixed the execution trace details to show information for an IPU rather than all IPUs.
Fixed BSP rendering if the IPU (Model) has been configured with a small number of tiles.
3.16.6. SSH Improvements
Added a visual warning if the SSH key is not valid in the preferences dialog.
Fixed the issue on Linux that requires the SSH path to be cleared to use SSH agent.
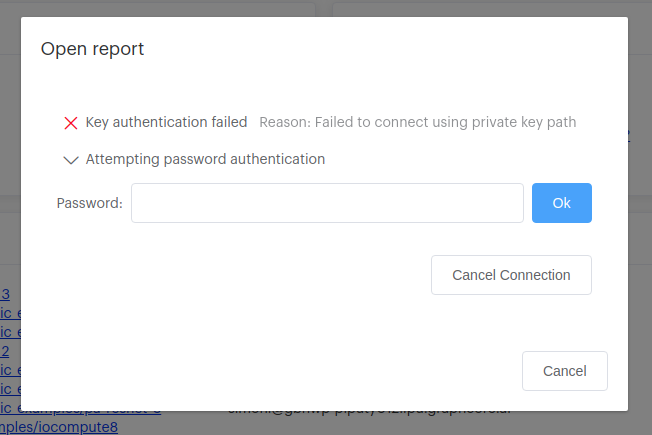
Added more diagnostic feedback in the connection dialog when SSH connection fails. In the example below, SSH into a machine failed and falls back to password entry:
3.16.7. General application-wide changes
The graphs now show a full width ‘bar’ for the first and last values on the graph. This improves the appearance of the graph when viewing memory by IPU (see below).
Fixed issues when comparing reports using Mk2 and Mk1 IPUs. Also fixed physical tile id mapping on Mk2 IPUs.
Adjusted dark mode support for ‘greyed out’ elements so they are more visible.
Added a new options button on graphs, allowing you to change the visibility of the graph keys:
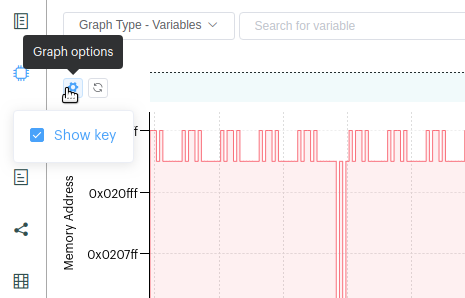
Improved the graph key display so that the text wraps correctly. The items in the key now change visually when your mouse is over them, and allow you to hide/show a dataset on the graph.
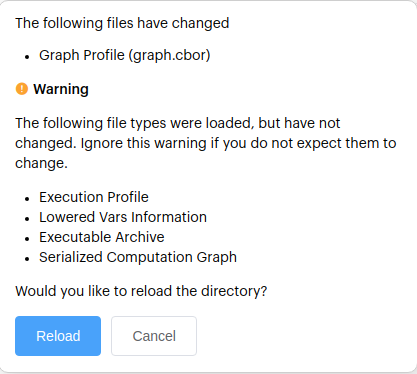
Added a new side-bar button to reload the reports, so you no longer need to close and reopen reports when they change. (i.e. when you recompile and run your model):
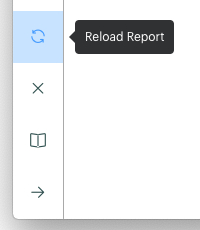
The application monitors the report file folder and detects whether any of the files have changed, alerting you to reload them:
Changed window quit behavior on MacOS so it doesn’t close the application when the last window is closed. Added a control to the preferences dialog to enable/disable it.
Added support for CenOS-based hosts, using MUSL to build the backend.
3.17. Version 2.0.0
1st July, 2020
Poplar Graph Analyser has been renamed PopVision™ Graph Analyser. Your preferences from the previous version are migrated the first time you run the PopVision™ Graph Analyser.
For more information on any of the items in the release notes please see the documentation
3.17.1. Capturing Reports
A new Poplar engine option has been added to make it easier to collect the reports used by the PopVision™ Graph Analyser.
''POPLAR_ENGINE_OPTIONS={"autoReport.all": "true"}''
3.17.2. Opening Reports
The ‘Open report’ and ‘Compare reports’ dialogs now include the modified date for each file & directory. The list can be sorted by name or date. The sorting methods you choose is saved as the default.
The ‘Open report’ dialog now has the option to specify the ssh port to use when connecting to a remote host.
The ‘Open report’ dialog prompts for a password if ssh key based authentication does not pass.
Opening reports from the “Recent” directory list now prompts for a password if needed.
3.17.3. Summary Report
The summary view now shows the contents of
framework.jsonorapp.jsonif present. Theframework.jsonis intended to be used by frameworks. Theapp.jsoncan be used by applications to save additional information about them.Added indicator to show which report files where found and which where not.
3.17.4. Memory Report
You can select multiple tiles and compare the differences between them. Either enter a comma-seperated list of tiles in the
select tile(s)input box or hold down the shift key while selecting tiles on the graph with the mouse. You can compare the details, vertices and varible layout for the selected tiles.The memory graph now supports keyboard input to move the selected tile left and right.
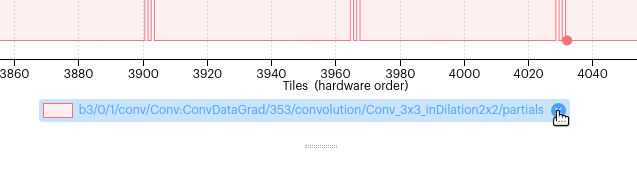
Added option to plot the memory usage of a variable across all tiles. You can either select the new “Graph Type - Variable” and search for a variable by name or click “Plot” after selecting a variable in the “Variables” tab. You will then see a graph of how much memory that variable needs on each tile.
You also have the option to show the layout of that variable in the address space of each tile. (Options-‘”>“‘Plot variables at address)
Multiple varaibles can be plots at the same time.
Added 2 interference options, when a variable is selected in the “Variables” tab, to show other variables which constrain the placement of the selected variable.
The key in the “Variables” tab is interactive, allowing you to select which types of variables you want to see.
Show stats (max, min, average, standard deviation) for the current range of tiles on the graph.
Fixed the calculation of the “overlapped” and “non-overlapped” categories in the deatils tab.
The “Details” shows the “Total including gaps” when opening just the archive.a file.
3.17.5. Liveness Report
New option to filter the steps in the graph based on a search string.
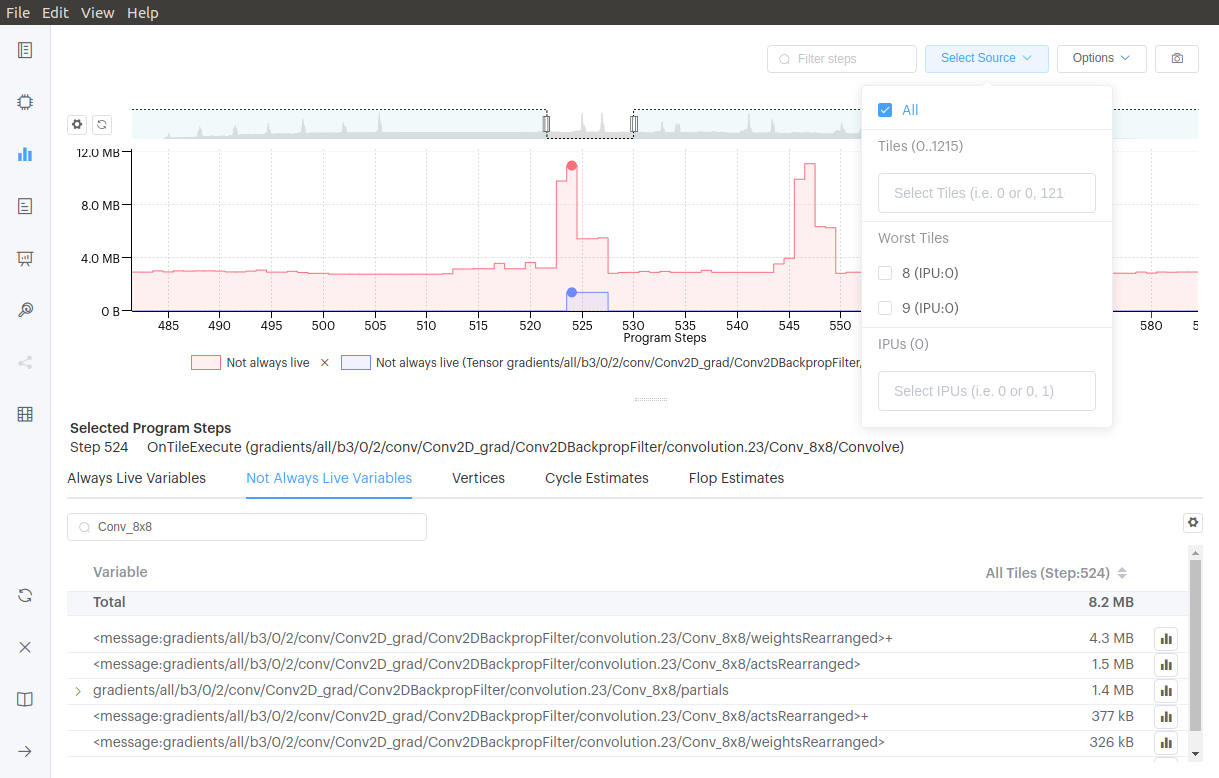
New select sources option. You can select liveness for all tiles, worst tiles or per IPU. Multiple sources may be selected at the same time.
The “Always-Live Variables” and “Not-Always-Live Variables” show a breakdown of variables across the sources (size & percentage).
When selecting multiple IPUs, you can select to show the plot stacked or unstacked (Options-‘”>“‘Stack IPUs).
New option to filter the list of variables shown in the tables.
3.17.6. Program Tree Report
A new search option has been added which highlights program steps based on a search string. Functions which have matching steps are also highlighted.
The steps in the program tree have been color-coded based on type.
The program tree allows the control flow steps to be folded & expanded.
3.17.7. Execution Trace Report
The options for selecting flat or flame graph have been moved out of the “Execution View” drop down into a new menu option the top left-hand corner.
New option to filter steps in the execution trace that match a string (only supported in flat mode).
Added the option to show the BSP trace below the exisiting execution trace. The BSP trace shows the detailed execution of each tile on the IPU. If you hover your mouse over the BSP trace a popop appears showing the details of the program step and the number of cycles executed on that tile for that step.
Added option to focus on the execution trace of 1 IPU or see all IPUs.
3.17.8. Comparing Reports
The compare reports feature has moved from an experimental feature to a standard feature. You can now select two reports and compare them.
“Compare two reports…” now appear as an option on the starting page.
New “Compare Reports” dialog allows you to select reports from local and/or remote.
The summary page shows the program, framework and application information for each report and highlights the differences.
The Memory Report show the memory requirements per tile for both reports. Details of both reports and the delta between them is shown. Vertices and Varaibles show information for the two reports side by side.
Selecting and ploting the variable from one report shows how the size and layout of that variable compares.
New options to show differences between the two graphs. You can see the delta and also the difference.
The livessness report shows the liveness plot for both reports. The size of the “Always-Live Variables” and “Not-Always-Live Variables” in each report and how they compare.
The program tree of each report can be seen side by side.
The execution trace of each report can be seen side by side, including BSP trace.
3.17.9. Help
The help page now has a search feature.
The tool now supports context sensitive help. If you hover your mouse over an area of the tool a popup appears which allows you to click on the link to take you to the relevant section of the help.
The context sensitive help tool tips can be disabled via the preferences dialog.
3.17.10. General
Changing options and moving between views no longer resets the view.
Table totals shown at the top, rather than the bottom.
All graphs now have a reset button at the top left corner that zooms out and deselects any items.
3.17.11. Experimental Features
Add new computation graph view based on Poplar’s serialized graph output.
Added the option to show liveness per variable.
3.18. Known issues
Scrolling using CTRL + mouse scroll-wheel does not work on Linux.
Only the ‘C:’ drive letter is supported on Windows.
Passphrases using Pagent do not work on Windows.
3.19. Installation
To install the PopVision Graph Analyser application to your computer, select the correct version of the app for your OS from the software download site . Then follow OS-specific instructions below.
3.19.1. Apple MacOS
Install the dmg package by double-clicking it.
The Graph Analyser app can now be run from Finder.
3.19.2. Linux Ubuntu
Change the permission of the downloaded
popvision-graph-analyser-[Version]-[Hash].AppImagefile to ‘executable’, either via the command line or via the GUI.Open the application by double-clicking on the AppImage. Note: You can use AppImageLauncher for better integration of AppImages with Ubuntu.
3.19.3. Microsoft Windows
Install the application and follow the installer steps.
The Graph Analyser can now be run from the Start Menu.
3.20. OS Compatibility
The following table lists the operating systems the PopVision Graph Analyser application will run on.
OS |
Support level |
Supported versions |
|---|---|---|
Apple MacOS |
Supported |
Monterey |
Microsoft Windows |
Supported |
Windows 10 |
Linux Ubuntu |
Supported |
18.04, 20.04 |
The following table lists the operating systems you can connect to when viewing reports on a remote host.
OS |
Support level |
Supported versions |
|---|---|---|
Linux Ubuntu |
Supported |
18.04, 20.04 |
Linux Debian |
Supported |
10.7 |
Linux OpenAnolis |
Supported |
8.4 |