3. Release notes
Please scroll to the bottom to view known issues, installation instructions and OS compatibility information.
3.1. Version 2.11.2
24th September, 2022
No changes for this release.
3.2. Version 2.10.0
17th August, 2022
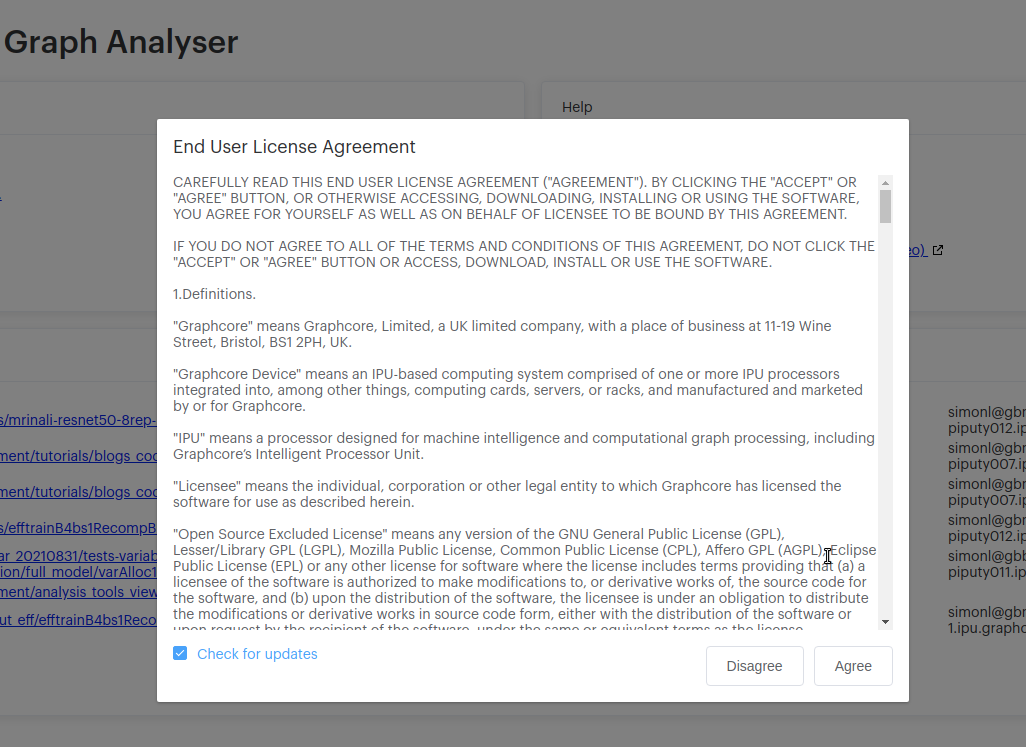
Please note that the End User License Agreement (EULA) for this release has changed, so you will need to agree to the new version.
When an event is selected, the indentation of nodes displayed in the Call Tree tab has been corrected.
3.3. Version 2.9.1
25th July, 2022
Line graph label values are now all formatted using the same scientific notation, making the values easier to compare with each other.
Line graph rendering speed has been improved.
If you have no remote files in your ‘Recent’ reports list, that column is now collapsed, giving more space for the local file paths.
The names of the reports on the Recent file list are now truncated, so you will no longer see a horizontal scroll bar. You can see the full name when hovering the mouse.
3.4. Version 2.8.0
14th June, 2022
The System Analyser now comes packaged with a Demo Report that you can use to try out the application’s features. Click the ‘Open Report’ button on the main page to view it.
You can now view PVTI ‘instant events’, which are displayed as ‘lollipop’ icons above the main timeline. These events can be added to your code using the standard
pvti.Tracepoint.event(channel, "Message")format. You can select the events to view their details in the tabs beneath the timeline.You can now type the magnification you want to zoom to in the graph navigation panel, rather than just selecting one of the pre- programmed magnification levels.
PVTI files may contain sub-microsecond events which are rounded down to zero duration. To make these visible on the timeline, we have set their length to 0.5µs (providing they do not overlap the next event), and changed their label to read “<1µs”.
Hovering the mouse over overlapping events in the timeline now shows details for all the events under the mouse pointer.
We have included instructions for connecting to the System Analyser from MacOS using X-forwarding. Please see the FAQ section of the in-app documentation for full details.
3.5. Version 2.7.3
25th May, 2022
This release fixes a recently introduced bug where selecting an event from the timeline no longer displayed its details in the tabs, and incorrectly reset the screen split proportion.
3.6. Version 2.7.2
13th May, 2022
Reduced the loading time for reports containing line graph data.
3.7. Version 2.6.1
12th April, 2022
When you start up the System Analyser, you are presented with a new dialog that asks your permission to collect telemetry data about your use of the PopVision tools:
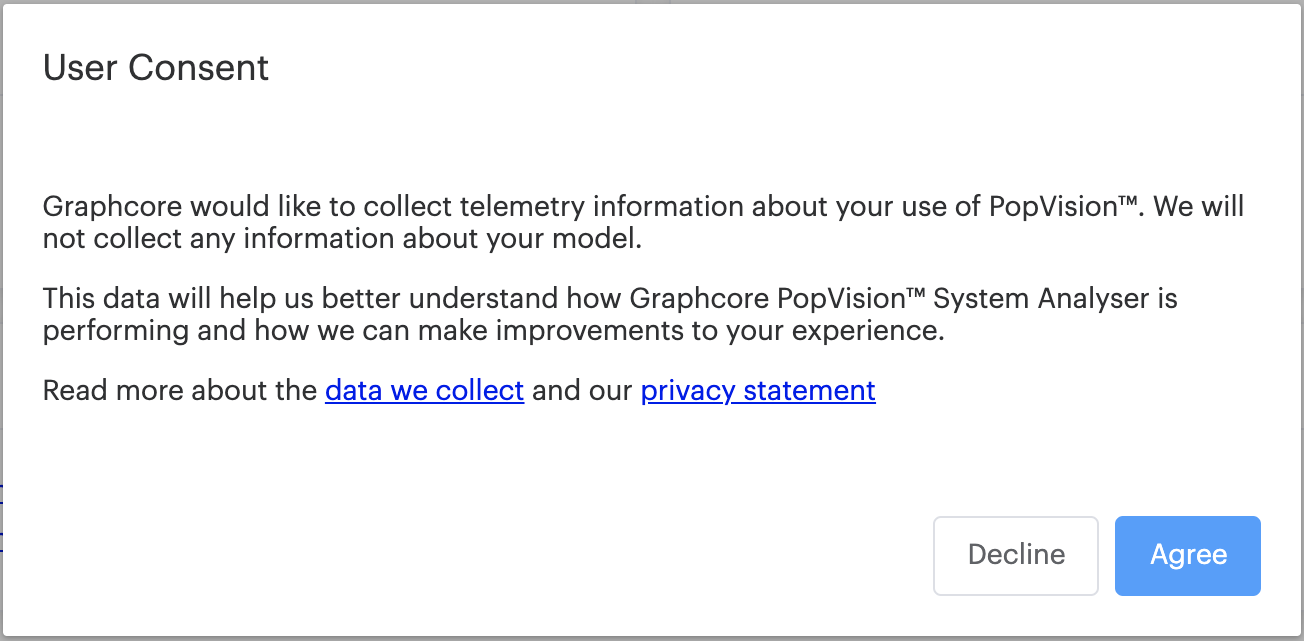
This helps us better understand how the application is performing, and how we can make improvements to your experience. No information about your models is collected. Please consult the documentation to read about the data we collect, or view our privacy statement on the Graphcore website.
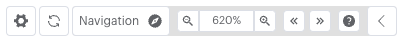
Navigation controls are now displayed in the top-left of the report graph, allowing you to zoom and pan with the mouse and keyboard. You can collapse and expand the control, and see the keyboard commands that you can use instead of the mouse.
The effect of scrolling vertically in a report has now been set to ‘scroll’, rather than ‘zoom’ as the default. You can, however, still change this setting in the application preferences.
You can now select multiple events in the System Analyser trace by shift-clicking. New columns appear in the event table, and multiple event tree tables exist in the call tree.
You can now double-click
.pvtifiles in your OS’s file browser to open them in the System Analyser. You can also select multiple files to open them all at once. (Not supported on Linux.)
3.8. Version 2.4.1
18th February, 2022
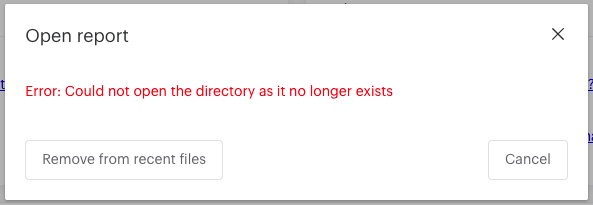
Report folders that have been moved or deleted can now be removed from the Recent reports list on the landing page.
The display of time durations of less than an hour has been improved to show appropriate units.
3.9. Version 2.3.1
21st January, 2022
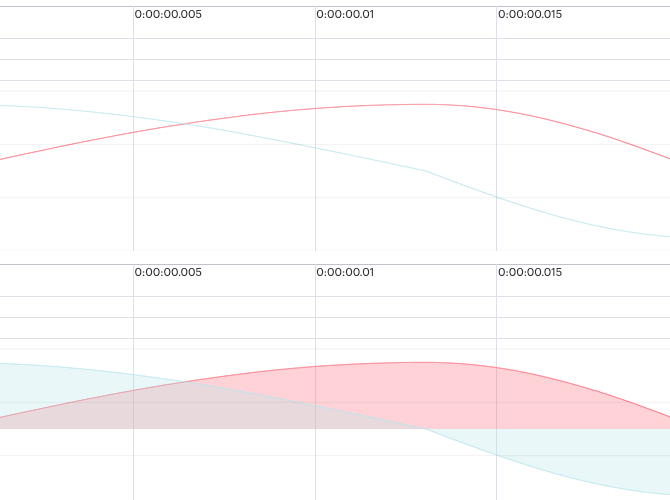
You can now choose to display line graphs as lines or as filled-in areas:
3.10. Version 2.2.0
20th December, 2021
This release adds some more new features, and addresses some display and error-reporting issues with previous versions.
The ‘Open file’ and ‘Compare reports’ dialogs now display a drop-down list of directories which updates to match the path entered. You can use the keyboard arrow keys to navigate and select paths from the list.
The ‘Recent’ report list on the landing page can now contain up to 64 previous report paths.
Fixed an issue when using SSH keys generated with the OpenSSH format.
Fixed an issue with the dark colour used for the derived IPU activity when in dark mode.
Fixed an issue where the SSH key location was not saved when selected via the file browser.
Dialogs can now be toggled between their default size and full-screen by clicking the resize icon to the left of the dialog’s title.
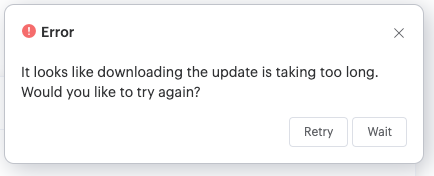
Errors that occur while downloading or installing an update are now displayed in a notification. If the download takes longer than a minute to complete, the option to retry it or continue is presented.
3.11. Version 2.1.0
10th November, 2021
This version sees a new search feature for the System Analyser, as well as further improvements in data handling and rendering performance.
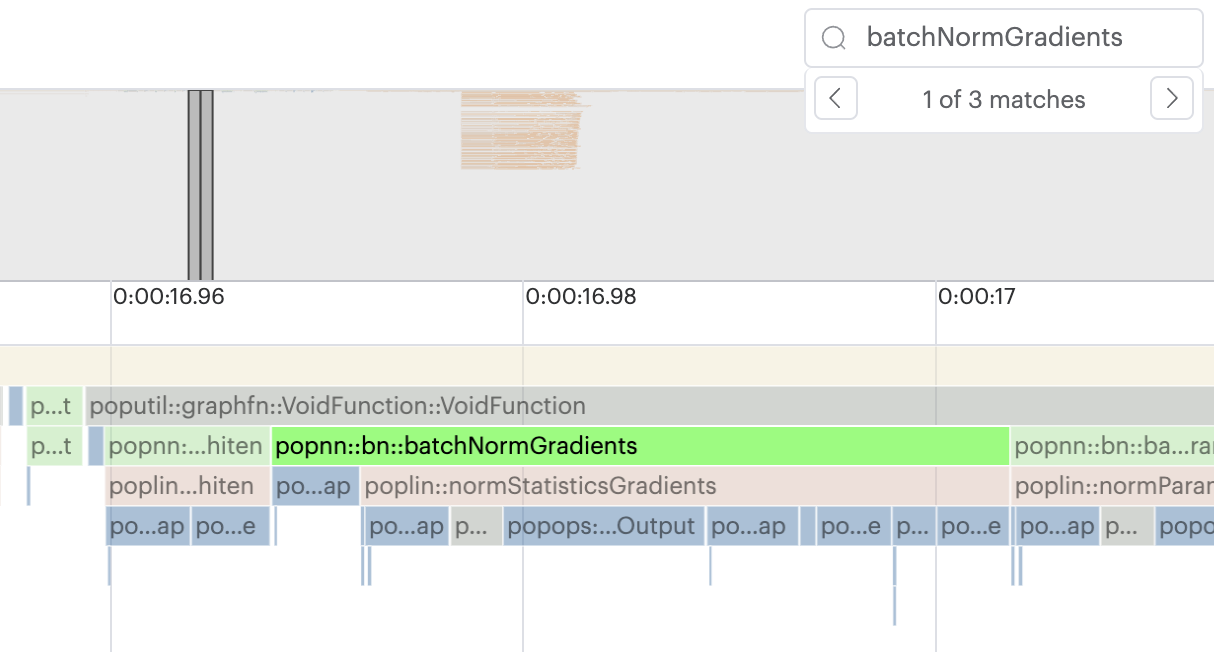
A new search feature allows you to find timeline events by name. You can cycle through any events that match your search term, and the timeline scrolls and zooms to display the current match at an appropriate size in the graph.
3.12. Version 2.0.3
26th October, 2021
Version 2.0 sees many new features and improvements brought to the PopVision™ System Analyser, including thread pinning, metadata support and software update.
3.12.1. Highlights
Pin threads or charts to the top of the window.
libpvtimetdata can now be displayed for the begin and end phase of an event.Automatic software update - the System Analyser will now periodically check whether it can update itself.
A new preference allows you to set the default behaviour for your mouse’s scroll-wheel: zooming or scrolling.
The Open Report dialog now remembers which tab you last used (local or remote).
Improvements to the display of numerical values in line graphs.
Better error reporting if the analysis engine upload fails.
An End User License Agreement must now be agreed to before using the application.
3.12.2. General improvements and bug fixes
In the Preferences dialog, you can now define the default behaviour for your mouse’s scroll wheel (or using two-finger drag on on a laptop trackpad).
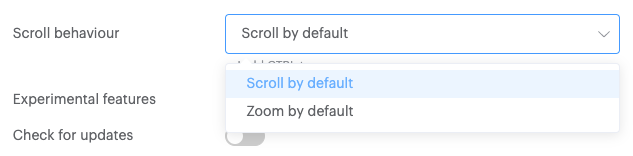 You can select either:
‘Scroll by default’, where the mouse wheel will scroll the window content up and down. Holding down the Ctrl key while using the scroll wheel then zooms the window content in and out.
‘Zoom by default’, where the mouse wheel zooms the window content in and out. Holding down the Ctrl key while using the scroll wheel then scrolls the window content up and down.
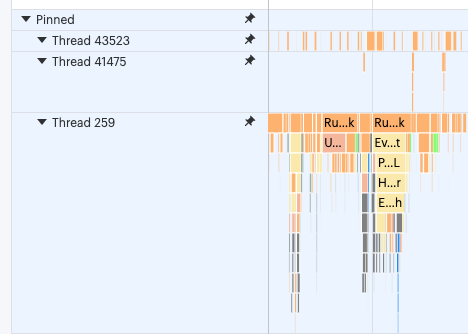
You can now click on the ‘pin’ icon on a thread or chart and it moves to the top of the window so that you can keep all the relevant threads grouped together. This makes it easier to compare different threads.
The System Analyser now supports
libpvtimetadata forpvtifiles of version 1.2 or higher. This allows you to associate information with thepvtitrace points, and then view that in the report. Here you can see an example of an index and the begin and end phase for a ‘function’: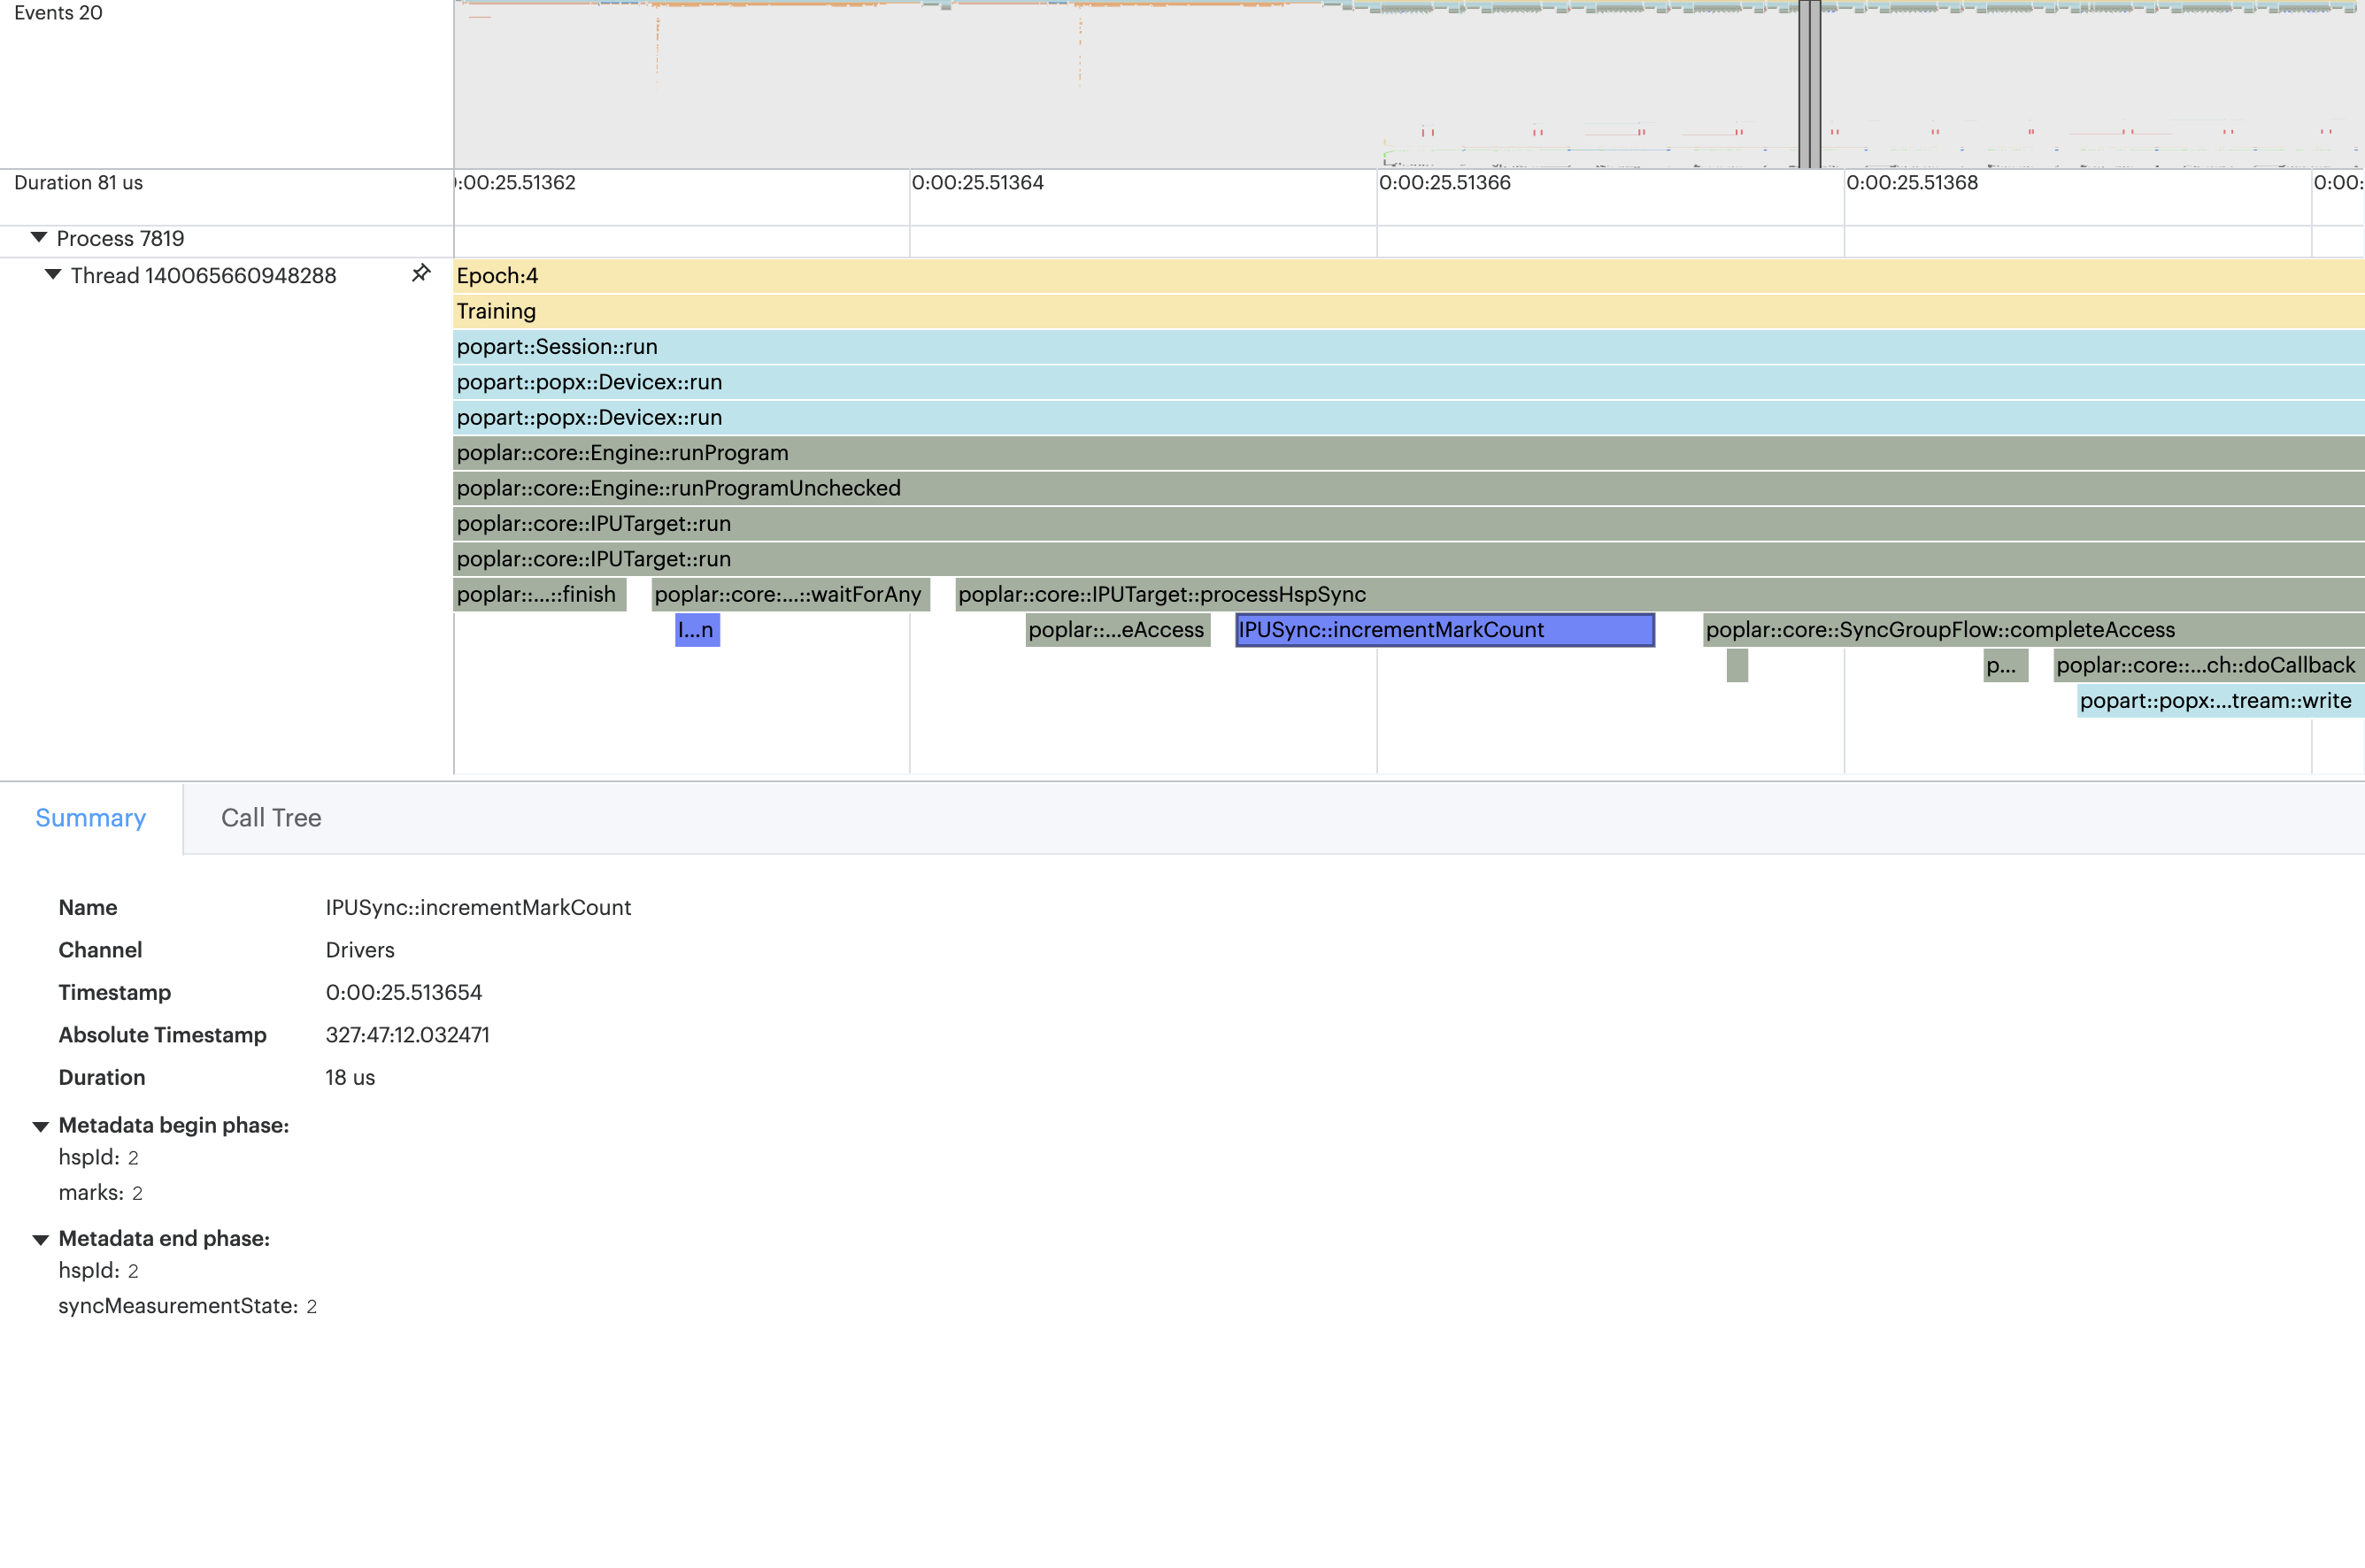
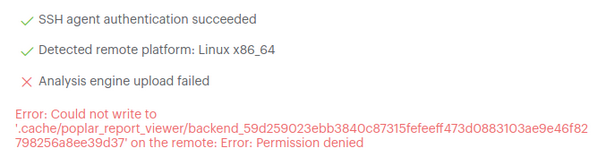
We have improved the error reporting when the System Analyser failed to upload the analysis engine to a remote host. Error reports will now show whether there was, for example, a permissions error, or no space to write the engine.
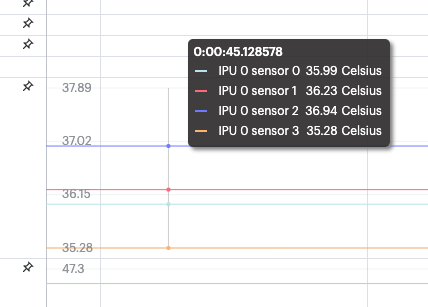
The line graph now supports smaller numerical ranges, so an appropriate number of significant figures can be displayed. The formatting of the numbers has also been improved:
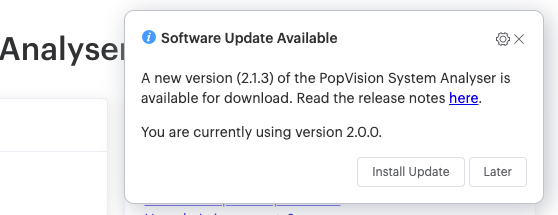
The System Analyser now periodically checks online to see if there is an update. If it finds one, it prompts you to download and install it. You can delay the download, or switch off the feature entirely in the Preferences.
To support software update functionality, when first starting the application an End User License Agreement is displayed (unless you’ve already agreed to it in a previous version of the application). To continue to use the System Analyser application, you must agree to the terms and conditions therein.
Note that you can opt out of the software download feature in this dialog, just as you can within the application’s Preferences dialog.
When saving a screen as an image, all the visible elements in the report are saved, as well as the theme.
We have resolved the slow down when writing to an NFS file system, which has also improved the writing time for reports by a factor of four. This fix requires the latest Poplar SDK release.
We have fixed an issue with older CTF (JSON) profiles with missing timestamps.
3.13. Version 1.3.5
16th September, 2021
3.13.1. Highlights
Improvements to the open report dialogs.
3.13.2. General improvements and bug fixes
Added the name of the remote host on the tab for the remote open report dialog.
Added a close button on the remote open report dialog.
Improved the layout of the file browser when you have a directory with lots of pvti files. It will now show the first 5 and allow you to expand that list if you want.
3.14. Version 1.2.4
25th June, 2021
For this version of the System Analyser, we have added the ability to read and plot scalar values onto a line graph.
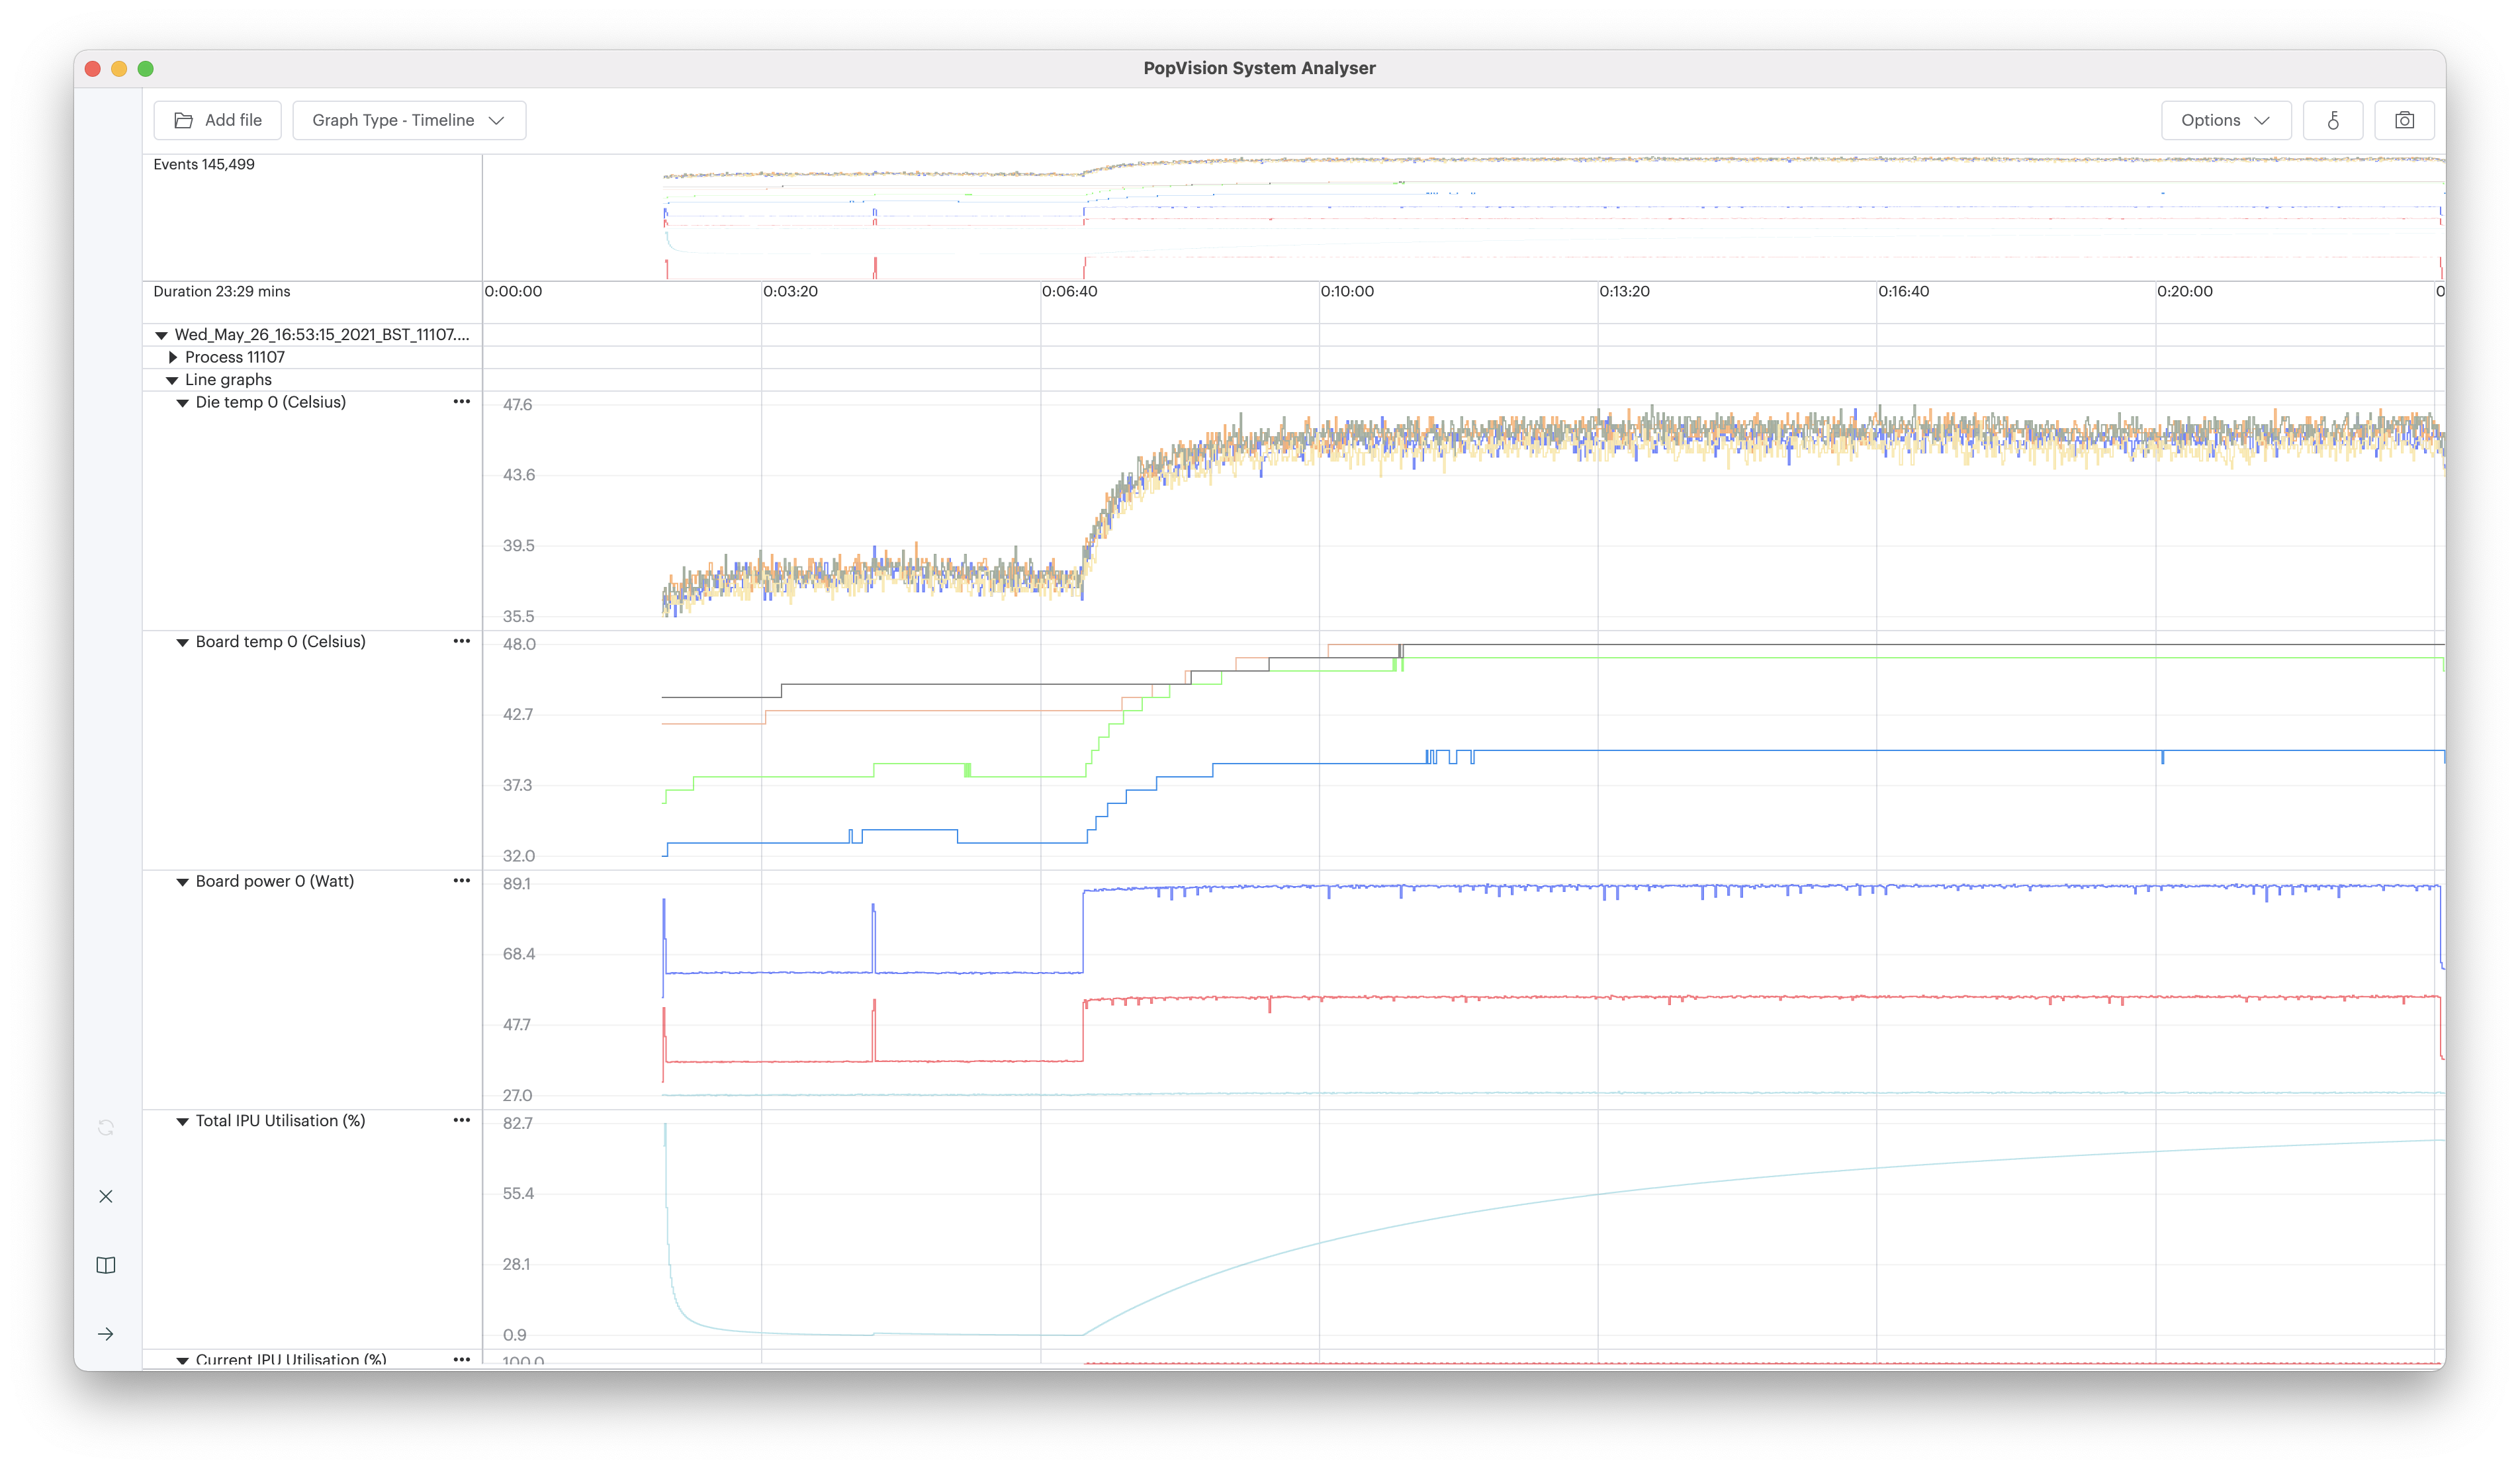
The ability to record custom scalar values to be drawn in the System Analyser has been added to the PopVision™ Trace Instrumentation Library ‘libpvti’.
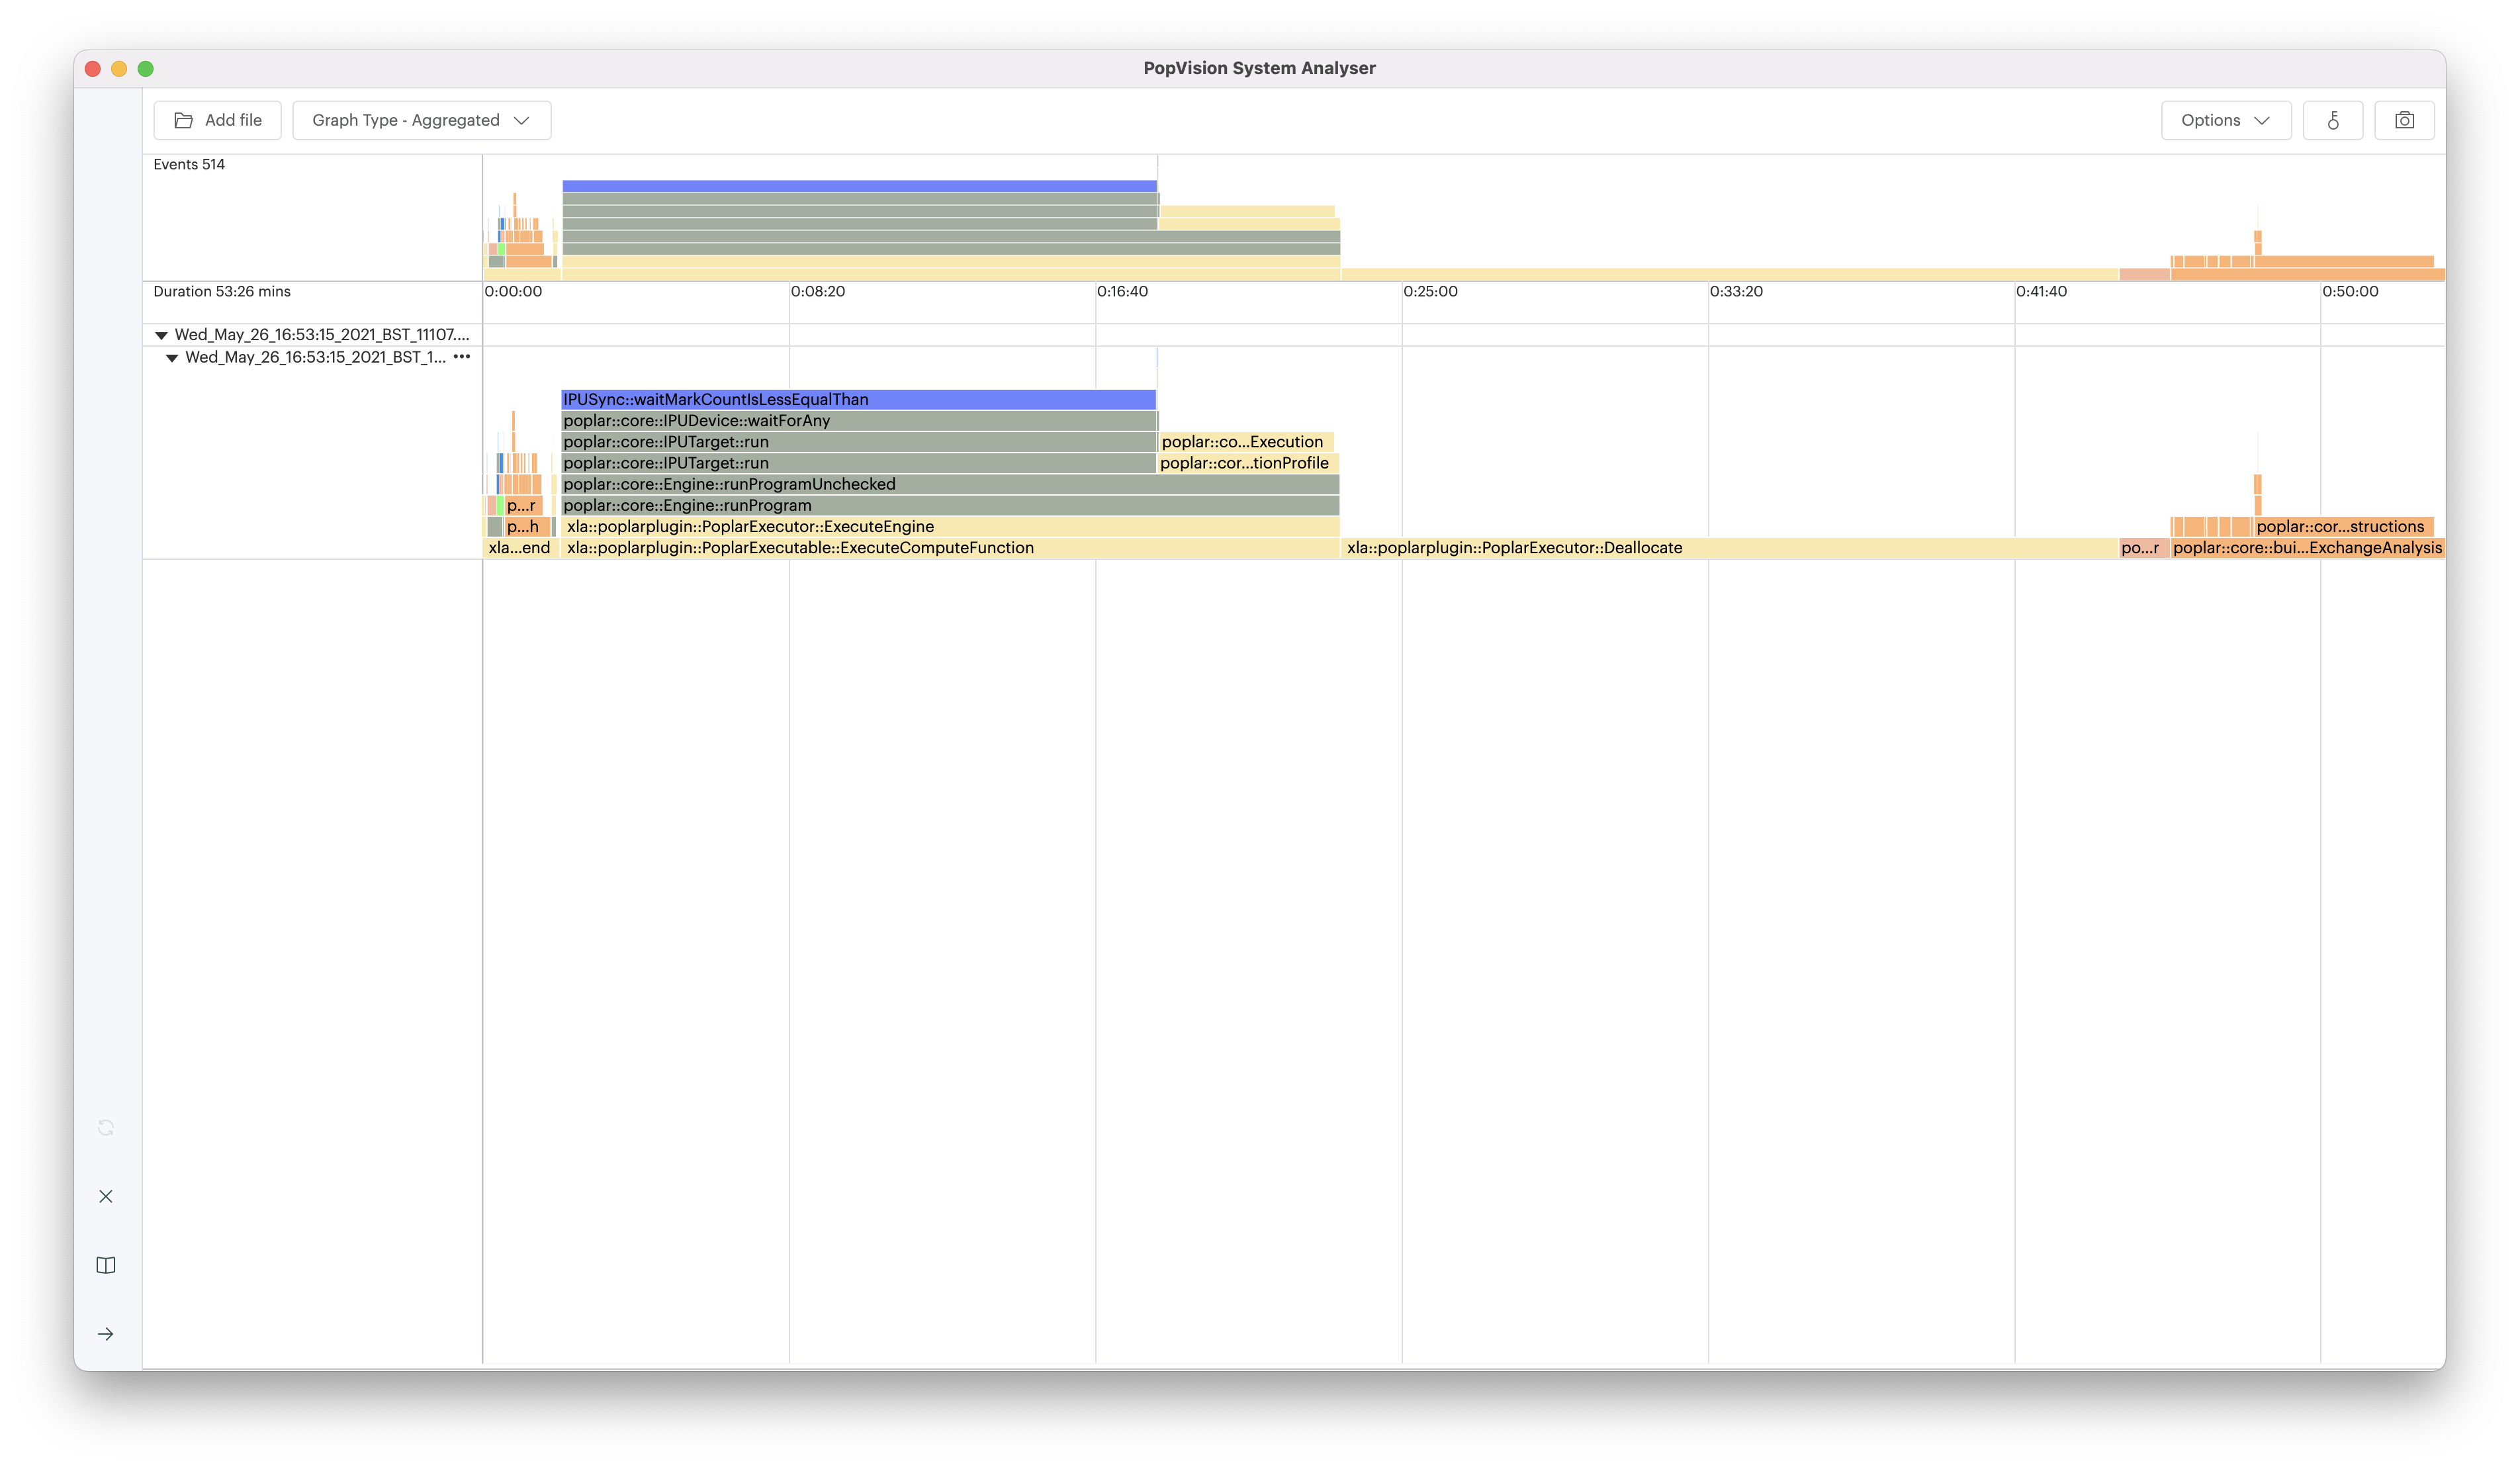
When looking at a report you can now switch to viewing the flamegraph in aggregated view. This will aggregate events with the same name, giving a total duration. This allows analysing the overall statistics of a large report easily.
3.15. Version 1.1.1
1st March, 2021
For the second release of the PopVision™ System Analyser we have added the much requested feature to open reports on a remote host, like the PopVision™ Graph Analyser.
When you click the “Open report” link, you will now get an Open file dialog with “local” and “remote” tabs, as you do with the PopVision Graph Analyser.
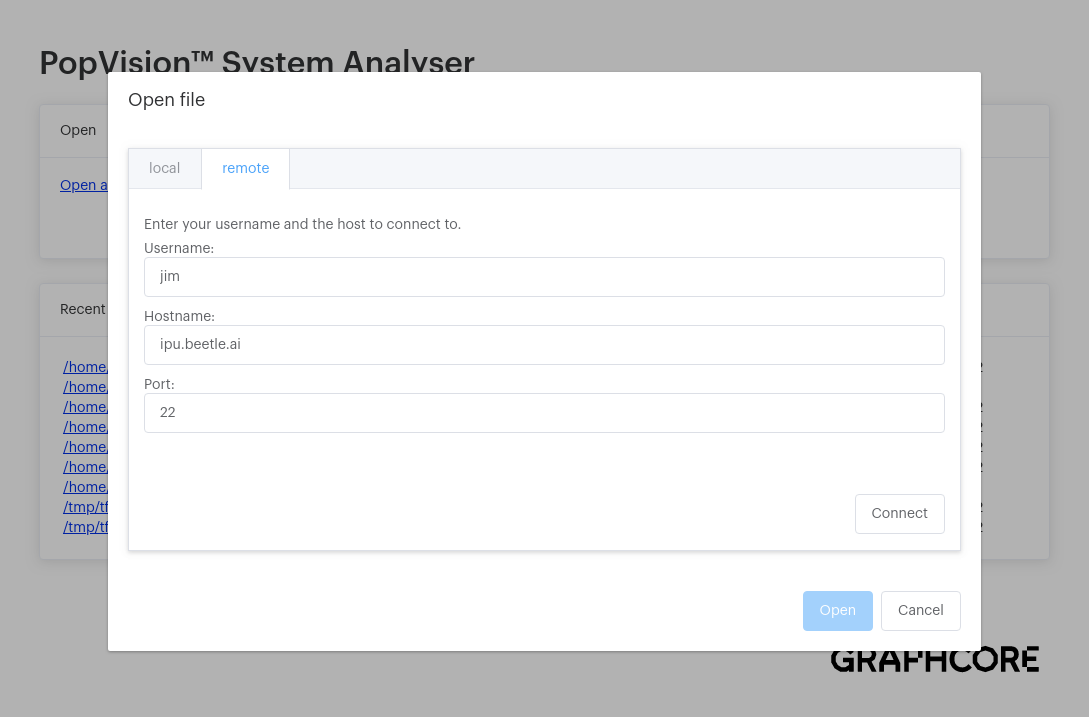
Enter your username and host address and the System Analyser will attempt to connect to the remote host over SSH. Depending on your ssh config you may need to enter you password. SSH options can be set in the preferences dialog.
When looking at a report you can now select a function in the flame graph and see the call tree for it.
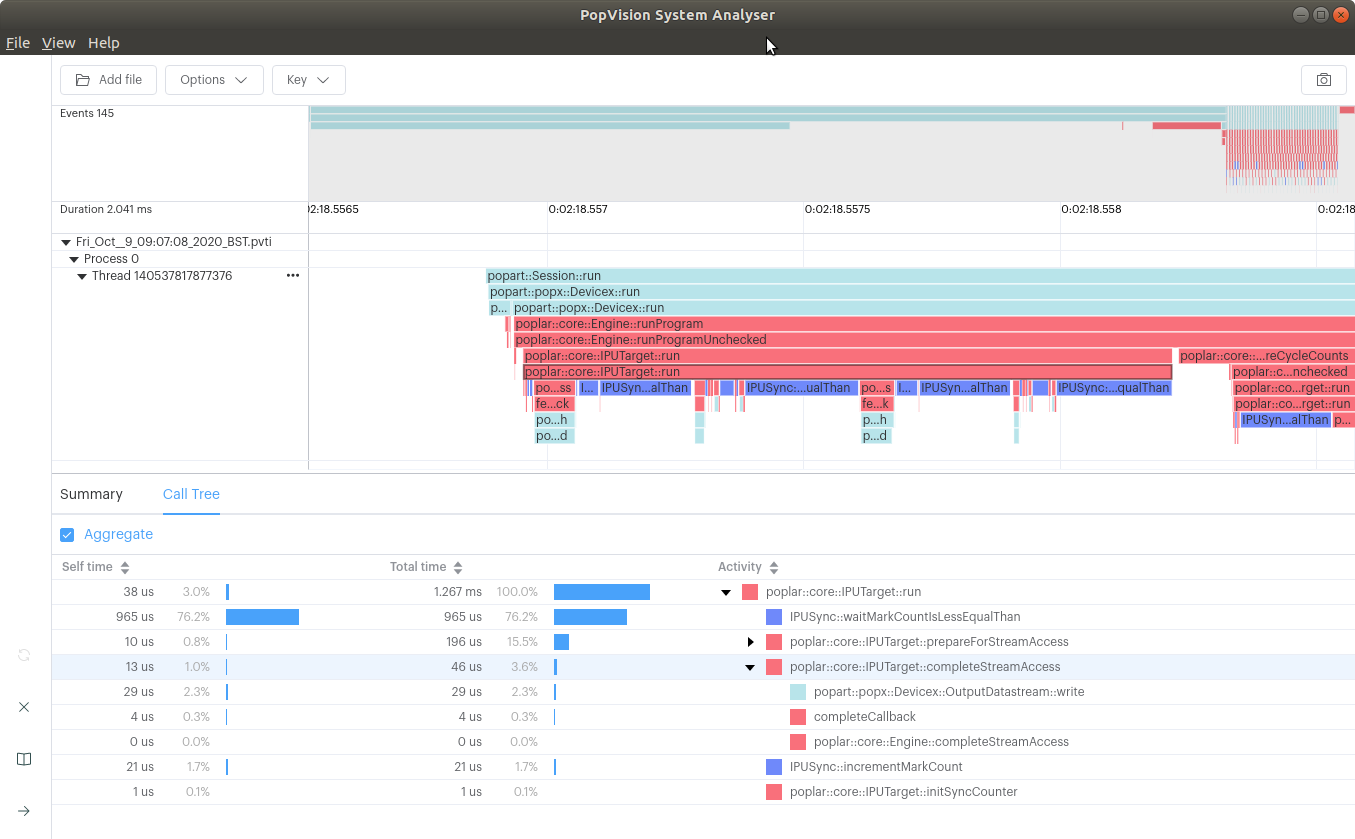
The call tree shows the nested call structure, the total time and the self-time (the time a function takes minus the time the functions is calls take) to help identify hot spots.
When testing of the System Analyser with machine learning frameworks on large system (POD128) it was seen that those frameworks create a large number of threads when executing and each thread generates its own pvti file. This can be difficult to see in the System Analyser, so to make it easier we have added options to collapse all threads down to just the ‘top-level’ function, and then selectively expand or collapse a thread of interest.
3.16. Version 1.0.7
7th December, 2020
The PopVision™ System Analyser allows developers to understand the execution of programs running on the host processor which control the IPU(s). The System Analyser shows the interaction between the host and the IPU(s) so that developers can understand where the bottlenecks are in the execution of their applications.
The PopVision™ System Analyser visualises the information collected by the PopVision™ Trace Instrumentation Library ‘libpvti’ (which is part of the Poplar SDK) during execution of an application. This instrumentation information is saved in a file with the extension ‘pvti’.
When the tool is first started you have the option to open a report, follow links to additional help, and to these release notes:
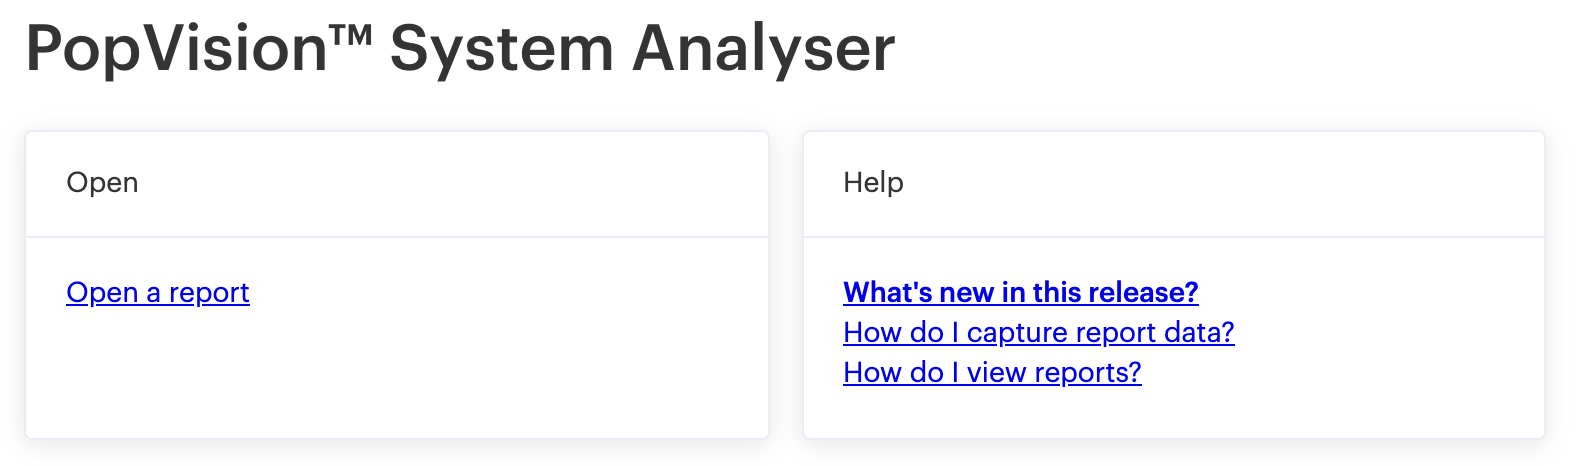
Note: PopVision™ System Analyser 1.0 only supports opening reports from your local machine. Remote host support is planned for a future release.
After the report has loaded, an execution trace is displayed:
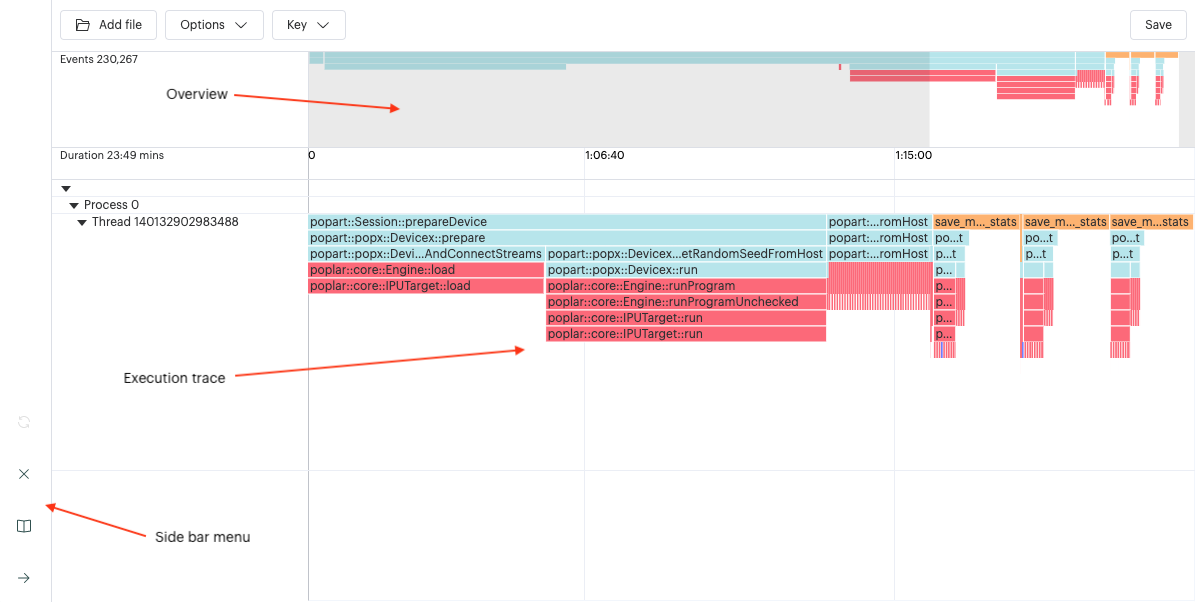
From here you can see:
The side bar menu, which allows you to close a report and return to the landing page, open the help window, and minimise and maximise the side bar.
At the top of the window, an overview of the execution profile information. You can select (mouse button down and drag) on the overview to select the range you want to view.
The main section of the tool allows you to zoom (mouse wheel) and pan (mouse button and drag) the profiled trace.
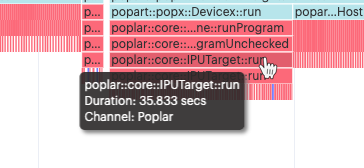
Each ‘block’ in the flame graph represents the time span between two points. In most cases that is the duration of a function or method.
As you move your mouse around over the flame graph you will see a tool tip giving you more information about that instrumented function:
Holding the SHIFT key down while panning allows you to measure the time between two points:
The colors indicate the different layers of the software stack (i.e. GCDA, Poplar, PopART)
The Key allows you to select which layers are displayed
When you click on any of the ‘blocks’ you can see the details of that instrumented function below:
The “Add file” option allows you to load additional PVTI files, allowing you to see the execution across multiple hosts.
The “Options” menu allows you to select absolute time vs relative time. Absolute time uses the timestamp directly in the different reports. Relative time uses the time delta from the begin of a file. The relative time option allows you to open different runs of the same application to compare their execution. The absolute option allows you to show execution when scaling your application across multiple hosts.
To the left of the flame graph you will see a collapseable tree of files/processes/threads.
The “Save” option (top left) allows you to save the current view of the flame graph to a png to be attached to other applications.
3.17. Known issues
Scrolling using CTRL + mouse scroll-wheel does not work on Linux.
Only the ‘C:’ drive letter is supported on Windows.
Passphrases using Pagent do not work on Windows.
3.18. Installation
To install the PopVision System Analyser application to your computer, select the correct version of the app for your OS from the software download site . Then follow OS-specific instructions below.
3.18.1. Apple MacOS
Install the dmg package by double-clicking it.
The System Analyser app can now be run from Finder.
3.18.2. Linux Ubuntu
Change the permission of the downloaded
popvision-system-analyser-[Version]-[Hash].AppImagefile to ‘executable’, either via the command line or via the GUI.Open the application by double-clicking on the AppImage. Note: You can use AppImageLauncher for better integration of AppImages with Ubuntu.
3.18.3. Microsoft Windows
Install the application and follow the installer steps.
The System Analyser can now be run from the Start Menu.
3.19. OS Compatibility
The following table lists the operating systems the PopVision System Analyser application will run on.
OS |
Support level |
Supported versions |
|---|---|---|
Apple MacOS |
Supported |
Monterey |
Microsoft Windows |
Supported |
Windows 10 |
Linux Ubuntu |
Supported |
18.04, 20.04 |
The following table lists the operating systems you can connect to when viewing reports on a remote host.
OS |
Support level |
Supported versions |
|---|---|---|
Linux Ubuntu |
Supported |
18.04, 20.04 |
Linux Debian |
Supported |
10.7 |
Linux OpenAnolis |
Supported |
8.4 |