1. Introduction to the available memory proportion option
All of the frameworks for the IPU, such as TensorFlow and PyTorch, make use of the facilities provided by the Poplar and PopLibs library functions. So, for example when a TensorFlow program needs to perform a matrix multiply (matmul), it will call the matmul functions in PopLibs.
The availableMemoryProportion option is used by PopLibs when deciding how to implement
operations on the IPU; in other words, how to convert the framework-level
operations into the low-level functions that execute on the IPU.
The option controls how much memory an operation (such as a matmul or convolution) will try to use for temporary values, intermediate sums and so on. For example, if a matmul operation has its available memory proportion set to 0.6 (representing 60% of memory) then the library implementing that multiply will try and produce code that uses no more than 60% of the IPU’s memory during its execution. This setting controls a trade-off between the amount of temporary memory used and the execution time of the operation.
We will discuss the option in relation to convolutions and matmuls, which are the most common use cases at the time of writing, but it may also apply to other PopLibs functions not covered here.
For information on how to set the option in each framework see Section 3, How to set the available memory proportion.
For more information about the profiling tools discussed, see the PopVision tools web page.
1.1. The convolution planner
At the core of the implementation of all convolutions and matmuls in a Poplar graph, is the PopLibs Convolution Planner.
This library is responsible for finding an optimal way of parallelising the convolution on the IPU. It considers the input and output dimensions, the parameters (such as the kernel size, padding and group size) as well as extra configurable options specific to the IPU. Its job is to decide how best to split up the execution of the convolution between the IPU tiles and into sub-operations, with intermediate or partial results (partials).
The Poplar tutorials contain an example (Tutorial 6: matrix-vector multiplication optimisation) that demonstrates a similar process to estimate the best way of splitting the data for a matmul across multiple tiles in order to get the best performance.
Although matmuls and convolutions are accessible from separate PopLibs functions
and have their own sets of options (which both include
availableMemoryProportion), all matmuls are actually implemented as
convolutions internally. From this point, we will mostly refer to convolutions
but the information and guidance provided is also true for matmuls.
At a high level, the planner works by considering many different possible plans and by choosing the best one to use, based on two estimated metrics. The first of these metrics is the number of compute cycles, which corresponds to the convolution’s compute performance. The second metric is an estimate of the additional temporary memory required to perform the convolution for the worst-case tile. There is a useful description of the difference between always live and temporary (not always live) memory in the technical note Memory and Performance Optimisation on the IPU. The temporary memory is used in this case to save the partials during the execution of the operation. As a result, this sets up a rather complicated multi-objective optimisation problem.
The planner splits the problem into two phases. The first one optimises for compute performance by generating a number of different plans and disregarding any plans that do not fit within a temporary memory budget. From those left, the best plan, the one with the lowest estimated number of compute cycles, is selected. If no plans are within the the initial memory constraint, it is assumed that the model won’t fit and so it then enters the second phase of planning. This phase mainly exists in order to produce a memory profile so that the user can diagnose what is causing the model to go out of memory. It does this by generating a plan optimising for temporary memory and disregarding the resulting compute performance.
The temporary memory budget used by the planner is where the available memory proportion option comes in. The option specifies the maximum memory that the planner should use in the first phase of planning, as a proportion of the total tile memory. By default, it is 0.6 (60% of tile memory), which works well in most cases. However, to achieve optimal performance, we sometimes need to adjust this parameter. Doing so results in some trade-offs, which we will consider later.
1.2. Setting availableMemoryProportion to a very small value
Setting availableMemoryProportion to a very small value can cause a large imbalance in tile usage. This happens because availableMemoryProportion controls temporary memory. This is the memory that becomes live for only a short time during the operation and is then freed for other operations to use. This means that memory for input/weight/output operands is not limited by the value of availableMemoryProportion.
The layout of the inputs/weights/outputs when allocated by the convolution library allocation functions are such that they are spread evenly among tiles that access each part of the those tensors. Generally we get a good spread over tiles because the fastest plan usually spreads the operation, and hence the allocation of the operands, over as many tiles as possible.
When setting availableMemoryProportion to a very small value, one plan that might meet that limit is one where the convolution is heavily serialised and processes very little in each iteration. In that case, the operation uses very few tiles because there is very little work in each iteration, and the temporary memory usage is low because it is just going to be based on the amount sliced from or updated into the weights/inputs/outputs in each iteration. The result is that all the input/weight/output operands can be allocated on only a few tiles, causing an imbalance in tile usage.
2. Worked example
We will use a simple demonstration model to illustrate two of the primary use cases for this compilation option. The example code is written in PyTorch using the torchvision implementation of ResNeXt. We are running this on a Mk2 IPU.
Download the source code: pytorch_demo.py.
We will use a configuration of this model to show the journey you might go on when adjusting the available memory proportion to fit, and then optimise, your model to run on an IPU. Although the example uses PyTorch, the same reasoning and approach can be used with any other supported framework for the IPU.
2.1. Use case 1: fitting a model or pipeline stage
In this case, we have a ResNeXt model set up for inference on a single IPU. However, when we run this code with the default settings, we see that the Poplar compilation fails with an out of memory exception:
$ python pytorch_demo.py
Out of memory: Cannot fit all variable data onto one or more tiles Context: LowerToPopart::compile Compiler::compileAndPrepareDevice popart::Session::prepareDevice: Poplar compilation
This error means that while lowering and compiling the model, Poplar ran out of memory to store all of the variables and code necessary to execute the model.
At this point, we have several things we could try in order to get our model to fit. For instance, we could reduce the batch size or use one of the various model splitting techniques for the IPU, such as pipelining or phased execution. Here, we will investigate whether we might be able to fit the model on the IPU just by adjusting the available memory proportion.
A good first step to perform when a model does not fit into memory is to inspect
the model profile using the PopVision Graph Analyser. See the profiling and Graph Analyser tutorial
for more information on how to do this. In this case we also need to enable the
debug.allowOutOfMemory engine option so that compilation completes and
generates a profile even after this exception is raised. This can be done, for example, by setting
the environment following variable:
POPLAR_ENGINE_OPTIONS='{"autoReport.all":"true", "autoReport.directory":"./profile", "debug.allowOutOfMemory":"true"}'
Note
From SDK 2.1 onwards, setting "autoReport.all":"true" will automatically set "debug.allowOutOfMemory":"true".
For this exercise, we should also set the PopLibs log level to output warnings:
POPLIBS_LOG_LEVEL=WARN
We will see the reason for this later on.
Now we rerun the model with those engine options:
$ export POPLAR_ENGINE_OPTIONS='{"autoReport.all":"true", "autoReport.directory":"./profile", "debug.allowOutOfMemory":"true"}'
$ export POPLIBS_LOG_LEVEL=WARN
$ python pytorch_demo.py
Poplar will generate the IPU reports needed for the PopVision Graph Analyser, with all of the reports enabled except for the execution trace (because the model cannot be executed if it is out of memory).
We should always start by looking at the memory report to check how the memory allocation has been balanced between tiles. In this case, the tile balance looks good so the next thing we want to look at is the memory liveness report. This view shows how the not-always-live memory in the y-axis (memory required temporarily while executing the model) for each compute set in the x-axis. For this model, we see the following profile:
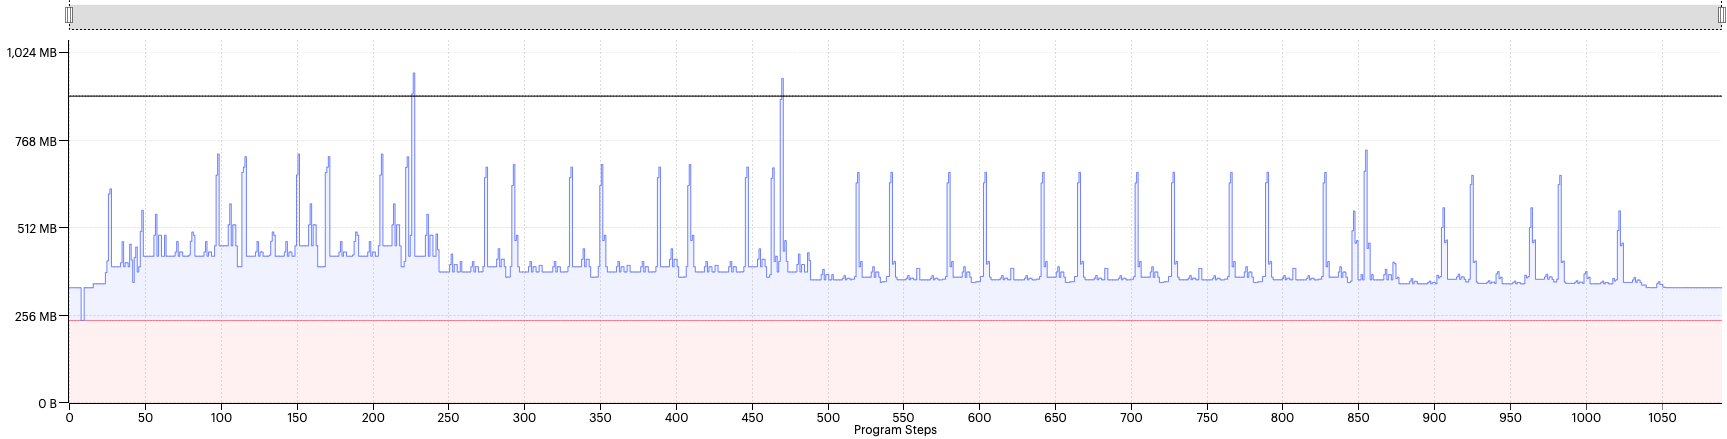
Fig. 2.1 Liveness report with availableMemoryProportion=0.8
The always-live memory is far below the maximum memory line in the profile display, but several liveness spikes are above the max memory line, causing the model to go out of memory.
In the Graph Analyser, you can zoom in and hover the cursor over a spike. This shows information about the code that this corresponds to and details of the memory use (Fig. 2.2).
From this we can see that all of the peaks are related to convolutions. This tells us that this might be an appropriate situation to try adjusting the available memory proportion to bring the size of those spikes down below the max memory line.
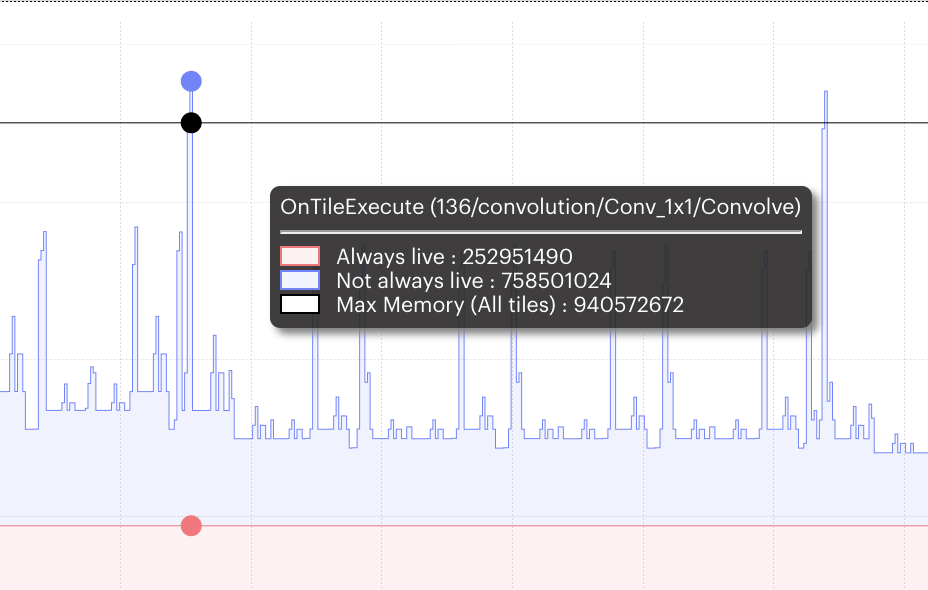
Fig. 2.2 Detail displayed for memory peak
If we go to the program-tree view and search for “convolution”, we can see that the PopLibs options have the available memory proportion set to 0.8 or 80% of per-tile memory.
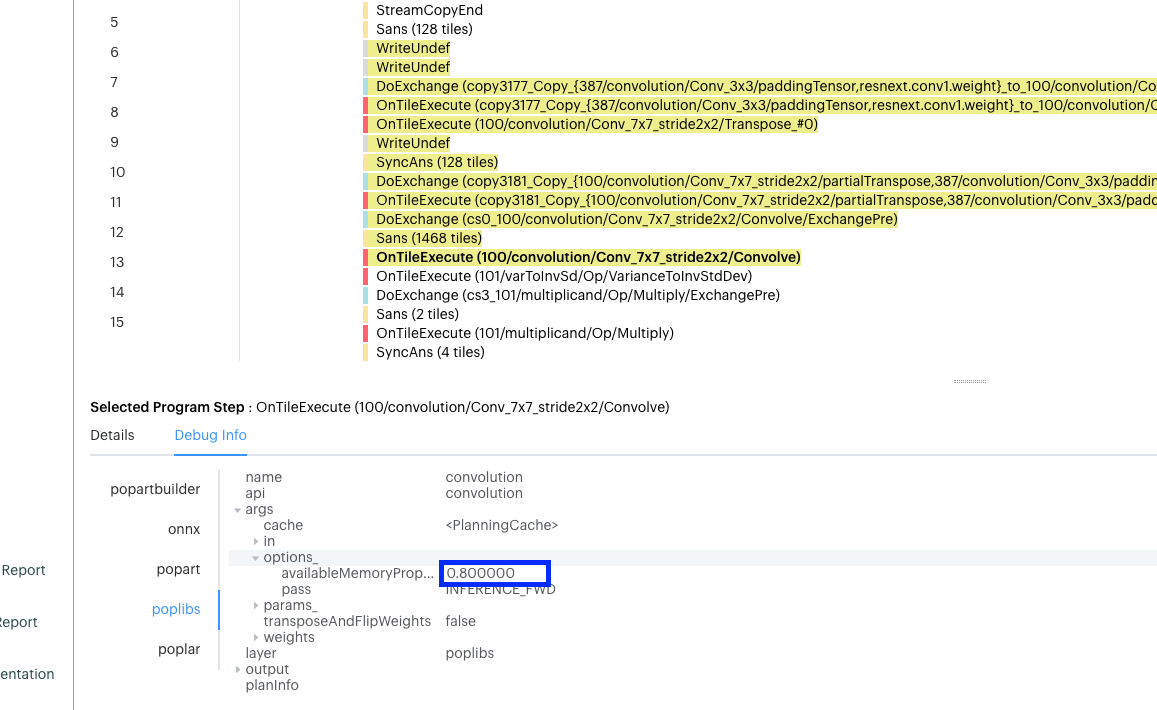
Fig. 2.3 Program tree view
In the code, we can see that this is the default being set for this model if no argument is passed in:
76    parser.add_argument("--batch-size", type=int, default=20, help="Batch size")
77    parser.add_argument(
78        "--available-memory-proportion",
79        type=float,
80        default=0.8,
81        help="Available memory proportion",
We can see from the profile that there is roughly 250 MB in total always-live
memory out of a possible 940 MB. That’s ~25%, leaving ~75% of the memory
available for temporary variables. So what happens if we bring the size of the
available memory proportion down very slightly to 0.75? We can do this by
running the same command as above but setting the
--available-memory-proportion option on the command line:
$ python pytorch_demo.py --available-memory-proportion 0.75
The corresponding Graph Analyser view is shown in Fig. 2.4.

Fig. 2.4 Liveness report with availableMemoryProportion=0.75
As we can see, the profile looks mostly identical. As described above, PopLibs first generates a set of convolution plans for each convolution and chooses the best plan based on the number of cycles that also fits within the available memory proportion. So, in this case, we can conclude that the best convolution plans still fit within the new setting of 0.75 for all of the convolutions.
Let’s try reducing the option further to the default setting of 0.6 (Fig. 2.5).
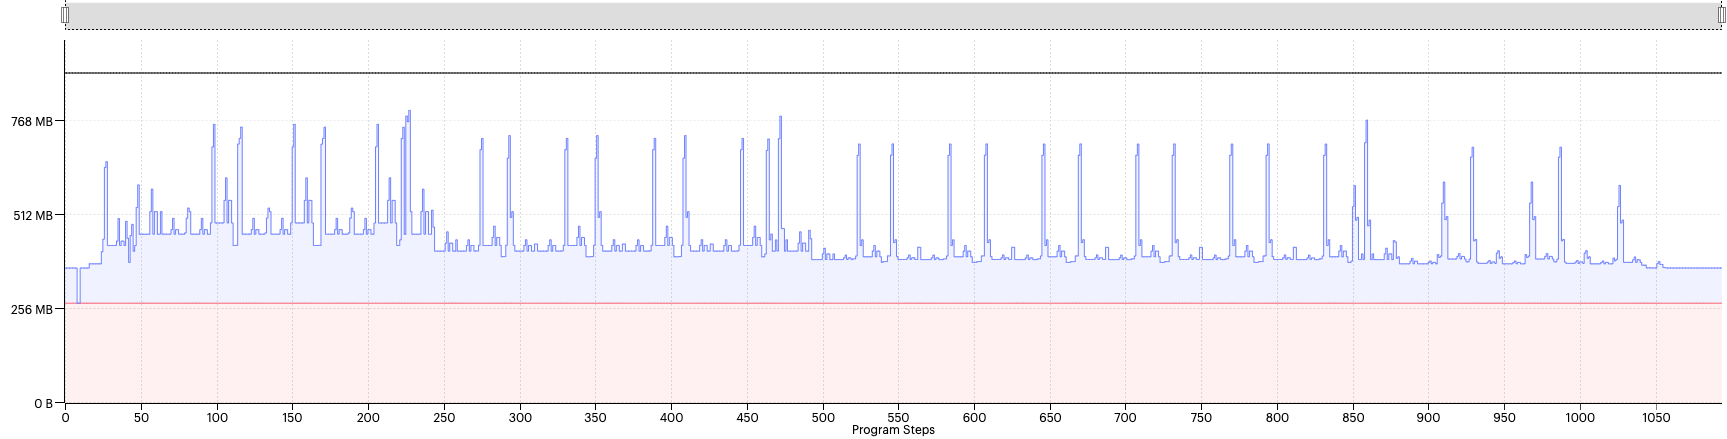
Fig. 2.5 Liveness report with availableMemoryProportion=0.6
With this setting, we can see that most of the spikes have reduced in size. That tells us that the planner has had to choose smaller plans in most cases.
From this view, it looks as though the spikes are below the maximum memory line. However, the code still fails to compile because it is out of memory.
This view shows the max memory for all tiles, so it does not consider the memory imbalance between tiles. We can view one of the worst offending tiles’ liveness by selecting the source in the top right corner of the view.
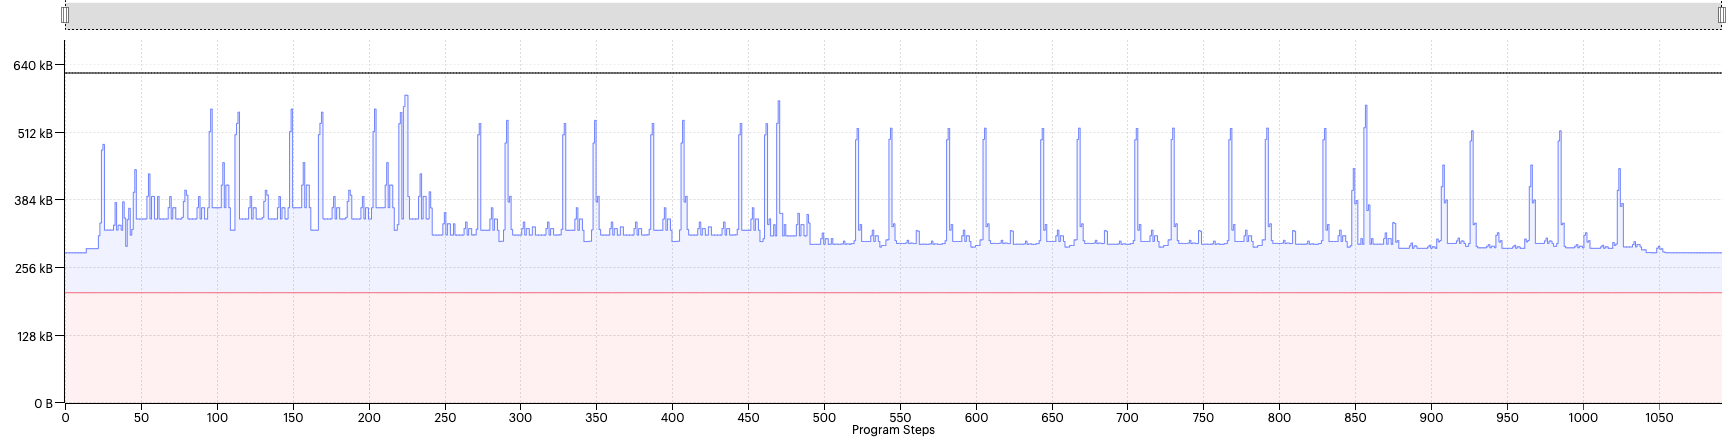
Fig. 2.6 Liveness report for tile 952 with availableMemoryProportion=0.6
Even in this view, it appears that the total memory is always below the max memory threshold. So what is going on here?
The reason for this is that the liveness view shows the sum of total memory and this does not reveal the full picture. In reality there will also be gaps present in the memory assignment that result from a number of memory placement constraints and the way that Poplar lays out variables. (See assembly-programming:memory_architecture for more information about the tile memory.)
While we cannot see these gaps in the liveness view, if we switch to the memory region report (Fig. 2.7), this will show us a better breakdown of the allocation per tile, taking the gaps into consideration.
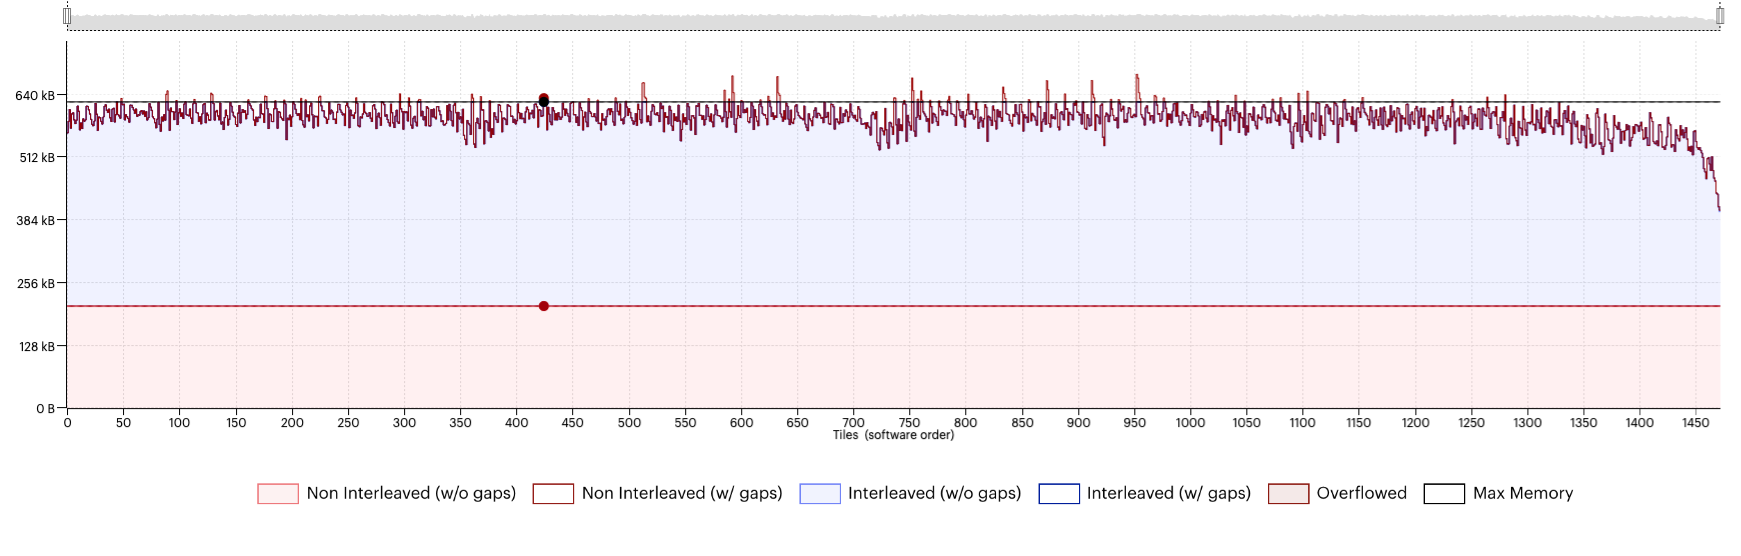
Fig. 2.7 Memory region report with availableMemoryProportion=0.6
Another thing we can see from the liveness report is that most spikes have flattened somewhat, but the liveness in between the spikes has increased. We can get a better view of what is going on here if we use the report comparison feature in the PopVision Graph Analyser to compare the liveness view in the memory report between the two configurations, Fig. 2.8.
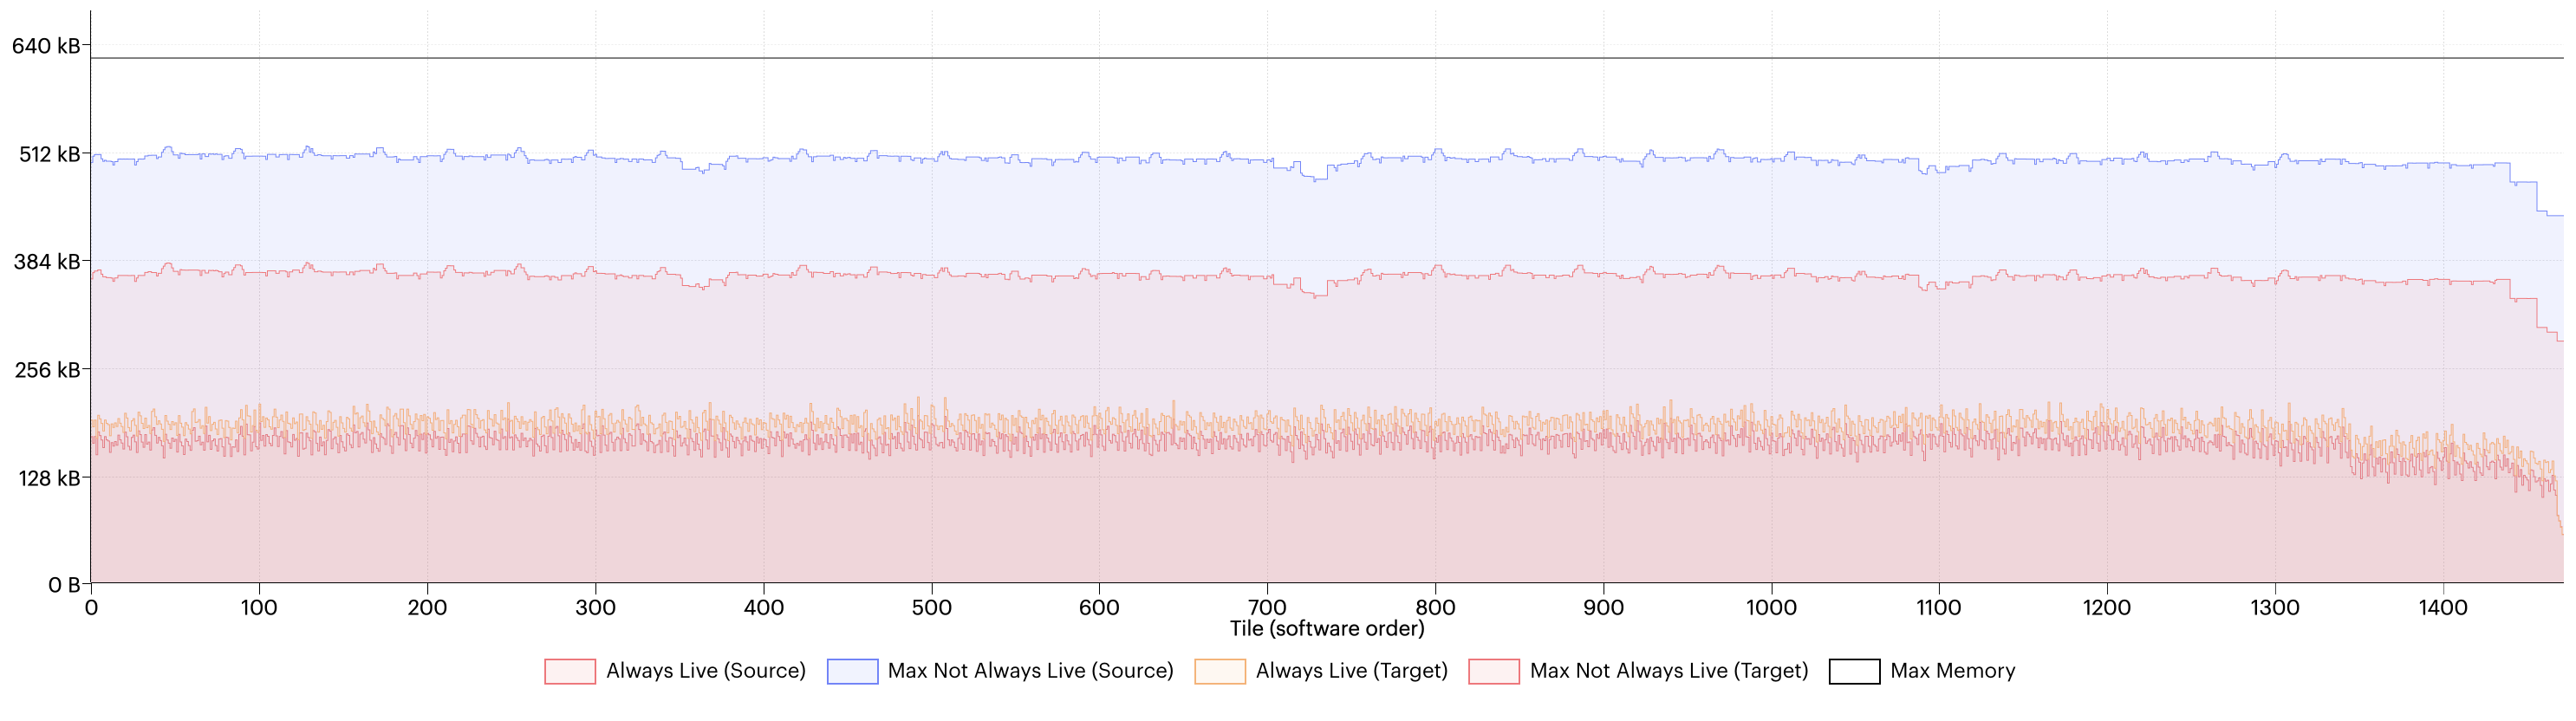
Fig. 2.8 Memory comparison between availableMemoryProportion=0.6 and 0.75
In this view, we can see comparison of the temporary/always-live split between the setting before (labelled “source” in the key) and after (labelled “target”). This shows us that while the maximum temporary memory has decreased (from the blue to the pink line) the always-live memory has increased (from the red line to the orange line). This is because the convolution planner considers the memory usage of the intermediate variables (the partials), but more memory conservative plans also involve more steps to execute and, consequently, more compute and exchange code to store as always-live memory. Therefore, being too aggressive in lowering the value might have a counter effect and the best threshold to use will depend on the model.
The PopLibs documentation for poplin::createWeights() recommends that
you do not set the available memory proportion below a value of 0.05. But, for
the purposes of demonstration, let’s try this anyway and see what happens when
we set it to 0.01:
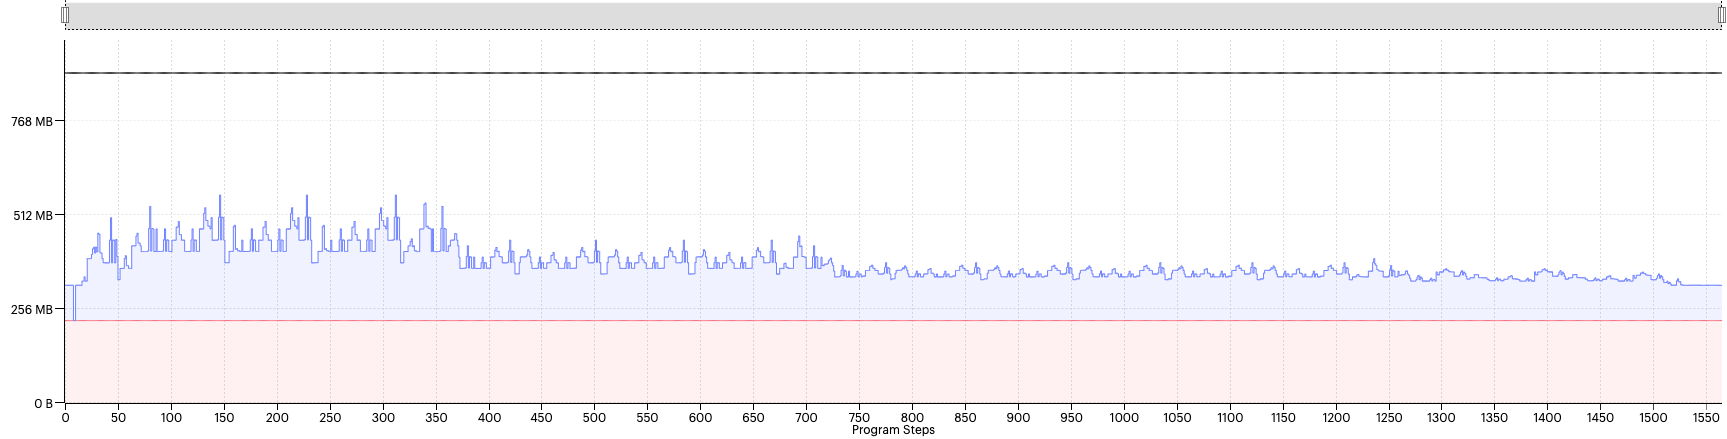
Fig. 2.9 Liveness report with availableMemoryProportion=0.01
Now we can see that the spikes have significantly reduced, and the overall liveness is much lower. However, the model still fails to compile due to being out of memory. We will look at why this in a moment but, out of interest, let’s try something even more extreme, 0.005:

Fig. 2.10 Liveness report with availableMemoryProportion=0.005
We see the profile looks identical to the previous profile, even though we have decreased the available memory proportion by half. Why is that?
Here is where it is often helpful to have PopLibs warnings enabled when adjusting the available memory proportion. If we look at the log output of the previous two configurations, we can see that PopLibs generated warnings such as the following:
PL:POPLIN [W] Warning: convolution planner unable to meet memory target. Optimising for minimum memory.
This warning means that the planner has moved into the second phase of planning to optimise solely for temporary memory. From this point, reducing available memory proportion even further will not affect the temporary memory for the convolutions in question.
Once the worst offending convolution is producing this warning, we may have to resort to other measures to get the model to fit, such as decreasing the batch size or using an IPU model splitting technique, as mentioned earlier.
So why has compilation run out of memory if so many convolution plans have switched to the memory optimised planning phase and the total liveness profile looks so small?
If we look at the memory report, we can see a significant tile imbalance caused by the chosen plans.
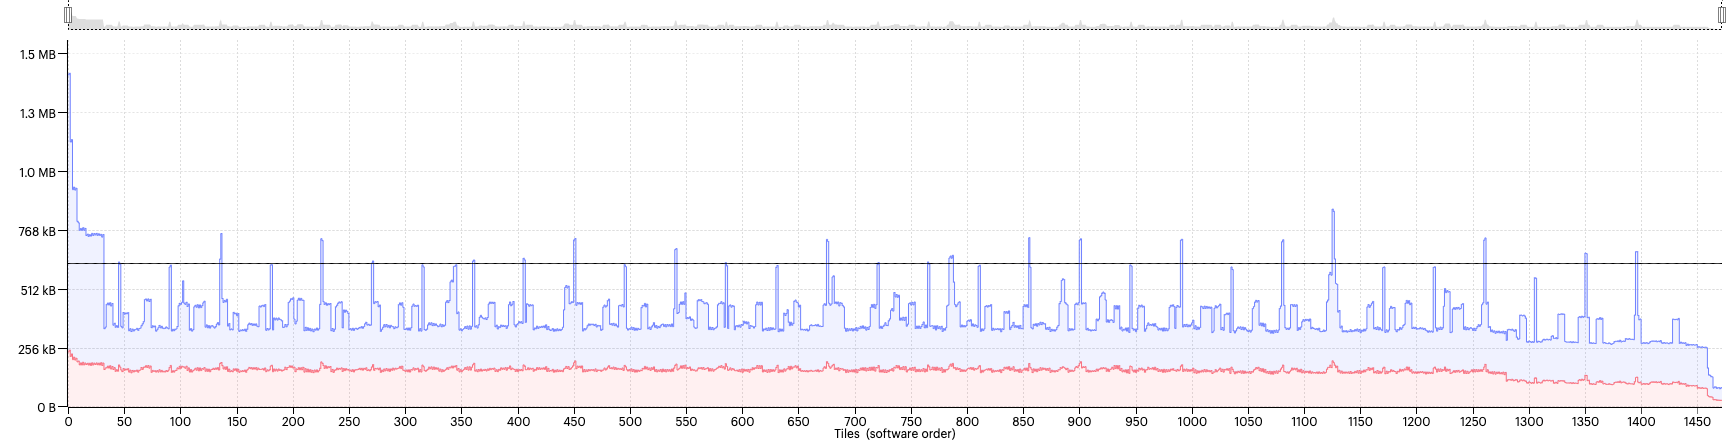
Fig. 2.11 Memory use per tile
This is because plans with extremely low temporary memory come with unpredictably large code and exchange requirements. Therefore, we should be careful not to set the option too low when choosing a value for available memory proportion.
So, can we find a sweet spot for this model? Well, let’s try a value of 0.35; Fig. 2.12.
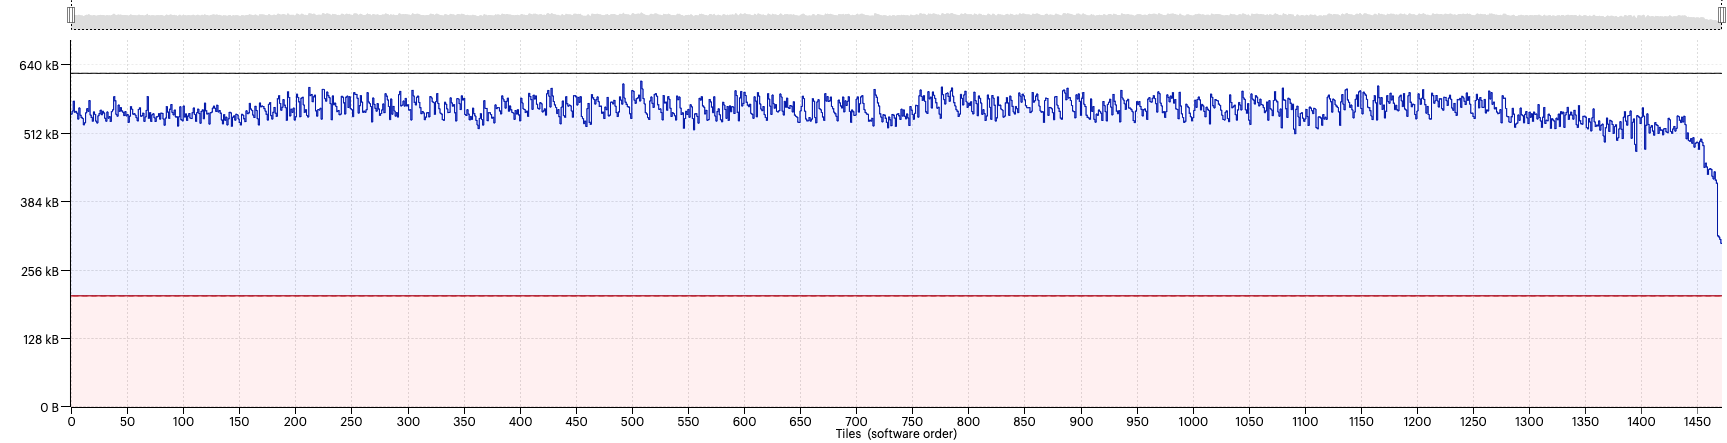
Fig. 2.12 Liveness report with availableMemoryProportion=0.35
Success, now the model fits and runs!
2.2. Use case 2: Optimising for throughput
In the previous use case, we considered using the available memory proportion to fit a specific model configuration onto the IPU. But this is rarely the whole story. Once we have a model that fits and runs, the next step is usually to optimise for performance. So, in this next use case, we will use the available memory proportion to obtain the best possible performance on the IPU.
For this use case, we might have to consider several different settings and hyperparameters that impact performance. There are also different ways to characterise performance such as throughput, latency or time-to-train. In this section we will look at the trade-off between available memory proportion and batch size, and its impact on the throughput.
The trade-off is reasonably intuitive. As batch size increases, we can achieve higher throughput as the number of samples processed in parallel during each IPU execution increases. However, to fit a higher batch size, we may have to decrease the available memory proportion, which means that the planner will select less performant convolution plans and the number of cycles for each execution of the IPU increases.
The inverse of this is also true: as batch size decreases, we can increase available memory proportion to select more performant plans, and so the number of cycles to process each batch decreases. Since this trade-off is very dependent on the architecture and dimensions of the model, we should perform a hyperparameter sweep of different values to determine the best configuration.
Table 2.1 shows the throughput for a range of batch size and available memory proportion values. For some values of these parameters, the model runs out of memory (OOM).
We can see that, for this configuration of the model, the best choice of batch size and memory proportion, in terms of throughput, is a batch size of 18 with available memory proportion set to the default of 0.6.
Note
The table is provided for illustration purposes only and shows indicative results for running this model on an IPU.
amp=0.1 |
amp=0.2 |
amp=0.3 |
amp=0.4 |
amp=0.5 |
amp=0.6 |
amp=0.7 |
amp=0.8 |
amp=0.9 |
|
bs=2 |
588.05 |
576.55 |
591.49 |
590.72 |
541.5 |
597.37 |
596.1 |
603.72 |
608.77 |
bs=4 |
835.15 |
825.98 |
856.77 |
883.68 |
868.95 |
862.76 |
879.52 |
846.37 |
906.57 |
bs=6 |
914.28 |
972.32 |
986.29 |
988.13 |
979.1 |
980.36 |
986.01 |
951.89 |
976.86 |
bs=8 |
1025.24 |
1064.98 |
1058.53 |
1069.05 |
1061.07 |
1088.21 |
1066.58 |
1060.78 |
1072.41 |
bs=10 |
994.63 |
1155.55 |
1229.29 |
1186.49 |
1196.37 |
1176.43 |
1182.56 |
1196.66 |
1218.32 |
bs=12 |
1067.39 |
1167.34 |
1200.66 |
1245.29 |
1255.65 |
1289.58 |
1239.25 |
1205.83 |
1228.99 |
bs=14 |
1164.32 |
1225.8 |
1240.3 |
1219.31 |
1213.38 |
1224.41 |
1209.84 |
1227.05 |
1240.22 |
bs=16 |
937.57 |
1203.84 |
1237.77 |
1287.91 |
1268.22 |
1281.14 |
1298.41 |
1316.73 |
1295.86 |
bs=18 |
938.62 |
1225.88 |
1309.89 |
1323.84 |
1331.72 |
1361.16 |
OOM |
OOM |
OOM |
bs=20 |
1058.59 |
1107.24 |
1317.09 |
OOM |
OOM |
OOM |
OOM |
OOM |
OOM |
bs=22 |
1079.51 |
1329.22 |
1359.47 |
OOM |
OOM |
OOM |
OOM |
OOM |
OOM |
bs=24 |
914.74 |
1141.68 |
OOM |
OOM |
OOM |
OOM |
OOM |
OOM |
OOM |
Download the code used to generate the table: sweep.py.
We looked at setting this option for a single IPU, and we took a journey to demonstrate some of the intuition involved in deciding how to choose an appropriate value. The framework APIs allow us to set the option per IPU stage. In this situation we must also consider where to choose the split points in the model, but the central reasoning remains the same.
3. How to set the available memory proportion
All Poplar frameworks have methods to set the option globally as well as per stage or per IPU.
This section signposts the relevant sections of the API documentation for
information on how to set the availableMemoryProportion option for each
framework.
There are also options in PopART and PopTorch to set the option per convolution.
When doing this, it is important to be aware that if two convolutions, which are
otherwise the same, have different settings for the option then they will not
be able to be outlined. Outlining is where code can be reused by different
operations in the graph, which saves a lot of code memory. So where the
convolutions previously could share the same code, they may now require separate
implementations, hence increasing the code size requirements. Therefore, it is
recommended in the majority of cases to keep the availableMemoryProportion
option the same for all operations on a particular IPU.
3.1. TensorFlow
In TensorFlow, there are three places you can set this option:
As a global convolution option (the default to use for all convolutions):
Set the convolutions.poplar_options attribute in the
IPUConfigclass (TensorFlow 1)Set the convolutions.poplar_options attribute in the
IPUConfigclass (TensorFlow 2)
For example:
# Set "availableMemoryProportion" to "0.5" for all convolutions
cfg = ipu.config.IPUConfig()
cfg.convolutions.poplar_options["availableMemoryProportion"] = "0.5"
cfg.configure_ipu_system()
Refer to Targeting the IPU from TensorFlow 1 and Targeting the IPU from TensorFlow 2 for more details about using the
IPUConfigclass to configure system options.As a global matmul option (the default to use for all matmuls):
Set the matmuls.poplar_options attribute in the
IPUConfigclass (TensorFlow 1)Set the matmuls.poplar_options attribute in the
IPUConfigclass (TensorFlow 2)
For example:
# Set "availableMemoryProportion" to "0.5" for all matmuls
cfg = ipu.config.IPUConfig()
cfg.matmuls.poplar_options["availableMemoryProportion"] = "0.5"
cfg.configure_ipu_system()
Refer to Targeting the IPU from TensorFlow 1 and Targeting the IPU from TensorFlow 2 for more details about using the
IPUConfigclass to configure system options.As a pipeline stage option for a specific pipeline stage (which will override any global settings for convolutions and matmuls for that pipeline stage):
PipelineStageOptions(TensorFlow 1)PipelineStageOptions(TensorFlow 2)
3.2. PyTorch
In PyTorch, as can be seen in the demo code, we set the option per IPU with
setAvailableMemoryProportion():
49
50    opts = poptorch.Options().deviceIterations(1)
51    opts.setAvailableMemoryProportion({"IPU0": availableMemoryProportion})
52
53    test_dataloader = poptorch.DataLoader(
54        opts,
55        GeneratedDataset(shape=[3, 224, 224]),
56        batch_size=batch_size,
57        shuffle=True,
58        num_workers=20,
59    )
60
You can also set the available memory option on a per-operator basis.
This is done with the operator set_available_memory().
The following example sets the available memory proportion to 0.2:
class BasicNetwork(nn.Module):
     def __init__(self):
         super().__init__()
         self.conv = nn.Conv2d(4, 4, 3, stride=2)

     def forward(self, x):
         out = self.conv(x)
         out = poptorch.set_available_memory(out, 0.2)
         return out
It is also possible to set the option per convolution when using the PopTorch
MultiConv class.
3.3. PopART
In PopART the option must be set using the
setAvailableMemoryProportion() method of the
Builder object for each operation while
building the graph. We must pass in the output tensor name of the operation we
wish to set the option for and a value.