3. Sensor monitoring
This section describes the sensor monitoring operations using the CLI, GUI, REST, IPMI and Redfish interfaces.
3.1. BMC command line
You can use the ipum-utils command for sensor monitoring. Table 3.1 lists the available commands.
Parameter |
Description |
|---|---|
|
Display sensors present on the IPU-M2000 with the current sensor value, threshold levels, scale and unit. Threshold levels are defined as CRIT_HIGH, CRIT_LOW, WARN_HIGH and WARN_LOW, which correspond to critical high and low values, and warning high and low values. |
An example of the output from the command is shown below:
$ ipum-utils sensor_list
NAME                                VALUE  CRIT_HIGH  WARN_HIGH   CRIT_LOW   WARN_LOW      SCALE       UNIT
fan0_0                              16319      18356      17522       7471       8405          0       RPMS
fan0_1                              15264      16911      16142       5040       5670          0       RPMS
...
fan4_1                              15418      16911      16142       5040       5670          0       RPMS
ps0_input_power                         0 1100000000 1000000000          0          0         -6      Watts
ps0_output_power                        0 1100000000 1000000000          0          0         -6      Watts
ps1_input_power                 292000000 1100000000 1000000000          0          0         -6      Watts
ps1_output_power                288000000 1100000000 1000000000          0          0         -6      Watts
total_power                     288000000 2200000000 2000000000          0          0         -6      Watts
IPU0_BGA_area_bottom                36447      70000      65000       5000      10000         -3   DegreesC
IPU0_CoreV_bottom                   38158      95000      90000       5000      10000         -3   DegreesC
...
ps1_outlet_temp                     48000      75000      55000          0          0         -3   DegreesC
ps_dimm_temp                        36500      90000      85000          0       5000         -3   DegreesC
IPU01_3V3                            3340       3465       3399       3135       3201         -3      Volts
IPU01_VDDDRV                         6704       7140       7004       6460       6596         -3      Volts
...
stby_2v5_volt                        2471       2625       2575       2375       2425         -3      Volts
stby_3v3_volt                        3332       3465       3399       3135       3201         -3      Volts
3.2. GUI
The sensor monitoring operations available in the GUI are described in Table 3.2.
Command |
Description |
|---|---|
Sensors |
Display the sensors present in the system with the current value and threshold values. You can filter sensors by severity with the “Filter by severity” button. |
Fig. 3.1 shows the IPU-M2000 sensor-monitoring GUI page for this operation.
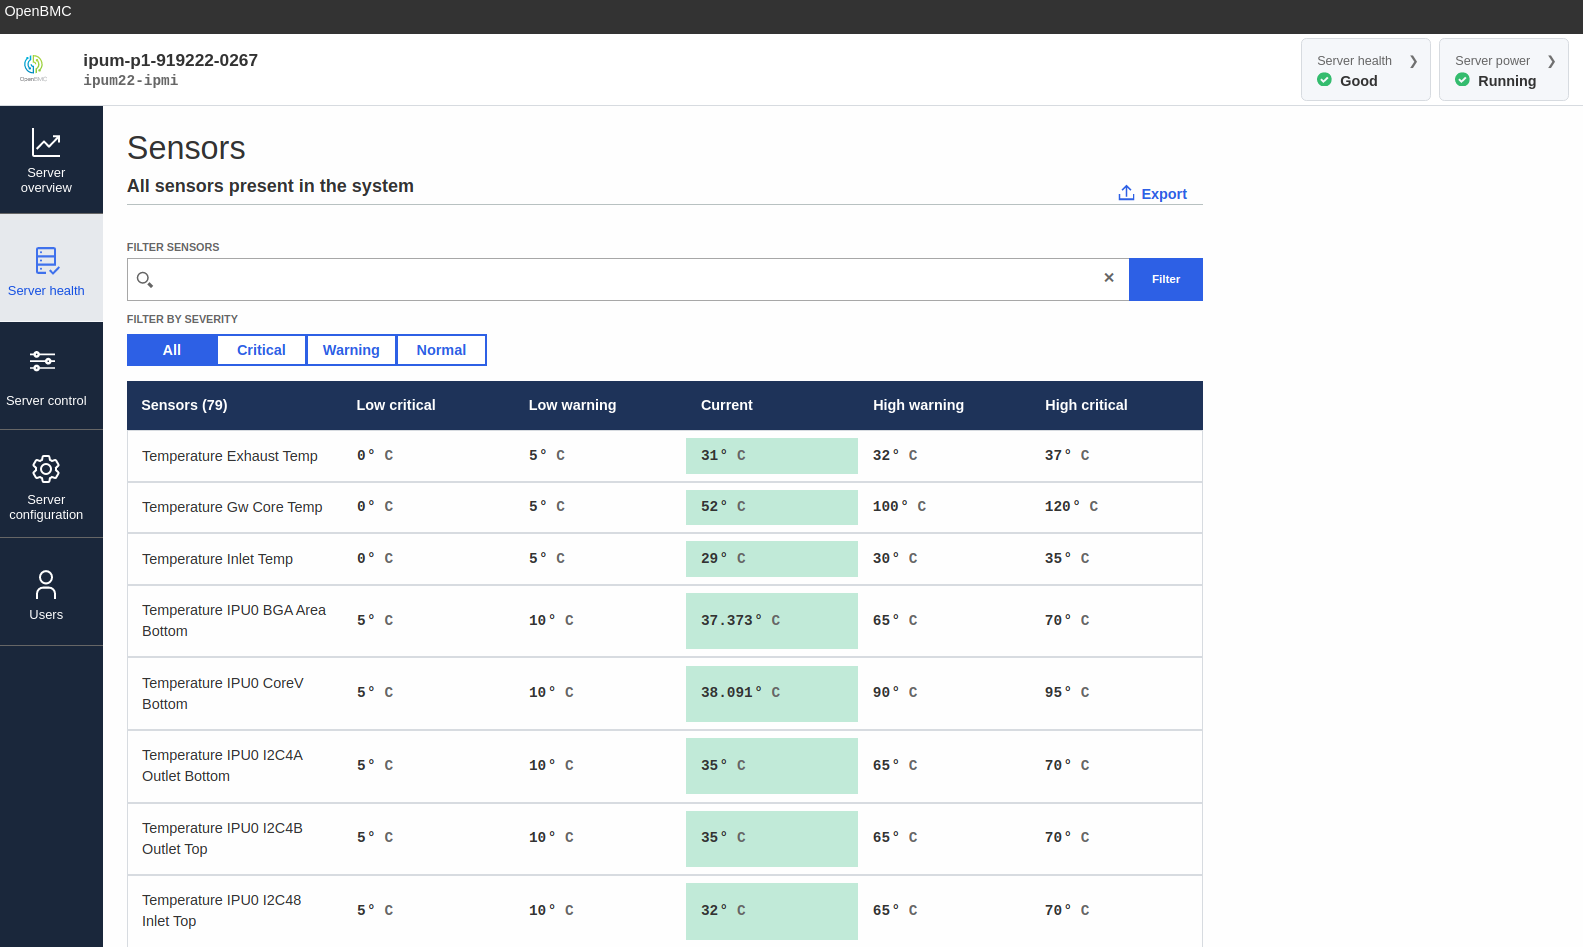
Fig. 3.1 GUI: IPU-M2000 sensor monitoring operations
3.3. REST API
You can perform sensor monitoring through the REST interface either by sending curl queries to the URI or by using the openbmctool.py utility.
Table 3.3 describes the commands available.
Command |
Description |
|---|---|
|
List sensors available in the system. Using the |
List all sensors: $ curl -k https://<bmcip>/xyz/openbmc_project/sensors/list -u <bmcuser>:<bmcpass>
$ python3 openbmctool.py -H <bmcip> -U <bmcuser> -P <bmcpass> sensors list
List sensor groups: $ curl -k https://<bmcip>/xyz/openbmc_project/sensors/<sensortype>/list -u <bmcuser>:<bmcpass>
Show individual sensors: $ curl -k https://<bmcip>/xyz/openbmc_project/ sensors/<sensortype>/<sensor_name>/list -u <bmcuser>:<bmcpass>
|
|
|
Display information associated with the sensor |
$ curl -k https://<bmcip>/xyz/openbmc_project/sensors/<sensortype>/<sensor_name>/enumerate -u <bmcuser>:<bmcpass>
|
|
Example output from the command:
$ python3 openbmctool.py -H <bmcip> -U <bmcuser> -P <bmcpass> sensors list
Attempting login...
sensor                    | type         | units     | value   | target
IPU0_BGA_area_bottom      | temperature  | DegreesC  | 37.408  | N/A
IPU0_CoreV_bottom         | temperature  | DegreesC  | 38.024  | N/A
...
stby_1v8_volt             | voltage      | Volts     | 1.802   | N/A
stby_1v15_volt            | voltage      | Volts     | 1.147   | N/A
stby_2v5_volt             | voltage      | Volts     | 2.471   | N/A
stby_3v3_volt             | voltage      | Volts     | 3.328   | N/A
total_power               | power        | Watts     | 288.0   | N/A
3.4. IPMI
Table 3.4 describes the ipmitool sensor-related commands that are
available.
Command |
Description |
|---|---|
SDR list |
Display sensor data repository (SDR) entry readings and their status |
$ ipmitool -I lanplus -C 3 -p 623 -U <bmcuser> -P <bmcpass> -H <bmcip> sdr list
|
|
SDR extended list |
Display extended sensor information |
$ ipmitool -I lanplus -C 3 -p 623 -U <bmcuser> -P <bmcpass> -H <bmcip> sdr elist
|
|
Sensor list |
Display sensors and thresholds in a wide table format |
$ ipmitool -I lanplus -C 3 -p 623 -U <bmcuser> -P <bmcpass> -H <bmcip> sensor list
|
|
SDR get |
Display information for sensor data records specified by sensor ID |
$ ipmitool -I lanplus -C 3 -p 623 -U <bmcuser> -P <bmcpass> -H <bmcip> sdr get <sensor_name>
The sensor name cannot be more than 16 characters long |
|
SDR type |
Display all records from the SDR repository of a specific type |
$ ipmitool -I lanplus -C 3 -p 623 -U <bmcuser> -P <bmcpass> -H <bmcip> sdr type <sensor_type>
Use the command |
|
Example output from the command is shown below:
$ ipmitool -I lanplus -C 3 -p 623 -U <bmcuser> -P <bmcpass> -H <bmcip> sdr elist
BootProgress     | 02h | ok  | 34.1 |
cpu0             | 08h | ok  |  3.1 | Presence detected
powersupply0     | 09h | ok  | 10.1 | Presence detected, Failure detected
powersupply1     | 0Ah | ok  | 10.2 | Presence detected
dimm0            | 0Bh | ok  | 32.1 | Presence Detected
dimm1            | 0Ch | ok  | 32.2 | Presence Detected
...
IPU3_I2C48_Inlet | A9h | ok  | 45.37 | 28 degrees C
IPU3_I2C49_Outle | AAh | ok  | 45.38 | 33 degrees C
3.5. Redfish
You can do
sensor monitoring through the Redfish interface either by sending curl queries or browsing the URI.
Sensors can be found in the Chassis collection available at https://<bmcip>/redfish/v1/Chassis/.
The Chassis collection represents a physical view of the IPU-M2000, containing items such as fans, power supplies and sensors.
The sensors are divided into three groups: thermal, power and voltage.
An example of using Redfish to view the thermal sensors associated with the chassis is shown below. The result of browsing the same endpoint is shown in Fig. 3.2.
$ curl -k https://<bmcip>/redfish/v1/Chassis/chassis/Thermal -u <bmcuser>:<bmcpass>
{
 "@odata.context": "/redfish/v1/$metadata#Thermal.Thermal",
 "@odata.id": "/redfish/v1/Chassis/chassis/Thermal",
 "@odata.type": "#Thermal.v1_4_0.Thermal",
 "Fans": [
   {
     "@odata.id": "/redfish/v1/Chassis/chassis/Thermal#/Fans/0",
     "@odata.type": "#Thermal.v1_3_0.Fan",
     "LowerThresholdCritical": 7471,
     "LowerThresholdNonCritical": 8405,
     "MaxReadingRange": 0,
     "MemberId": "fan0_0",
     "MinReadingRange": 0,
     "Name": "fan0 0",
     "Reading": 10890,
     "ReadingUnits": "RPM",
     "Status": {
       "Health": "OK",
       "State": "Enabled"
     },
     "UpperThresholdCritical": 18356,
     "UpperThresholdNonCritical": 17522
   },
   {
     "@odata.id": "/redfish/v1/Chassis/chassis/Thermal#/Fans/1",
     "@odata.type": "#Thermal.v1_3_0.Fan",
     "LowerThresholdCritical": 5040,
     "LowerThresholdNonCritical": 5670,
     "MaxReadingRange": 0,
     "MemberId": "fan0_1",
     "MinReadingRange": 0,
     "Name": "fan0 1",
     "Reading": 7830,
     "ReadingUnits": "RPM",
     "Status": {
       "Health": "OK",
       "State": "Enabled"
     },
     "UpperThresholdCritical": 16911,
     "UpperThresholdNonCritical": 16142
   },
   {
     "@odata.id": "/redfish/v1/Chassis/chassis/Thermal#/Fans/2",
     "@odata.type": "#Thermal.v1_3_0.Fan",
     "LowerThresholdCritical": 7471,
     "LowerThresholdNonCritical": 8405,
     "MaxReadingRange": 0,
     "MemberId": "fan1_0",
     "MinReadingRange": 0,
     "Name": "fan1 0",
     "Reading": 10752,
     "ReadingUnits": "RPM",
     "Status": {
       "Health": "OK",
       "State": "Enabled"
     },
     "UpperThresholdCritical": 18356,
     "UpperThresholdNonCritical": 17522
   },
   {
     "@odata.id": "/redfish/v1/Chassis/chassis/Thermal#/Fans/3",
     "@odata.type": "#Thermal.v1_3_0.Fan",
     "LowerThresholdCritical": 5040,
     "LowerThresholdNonCritical": 5670,
     "MaxReadingRange": 0,
     "MemberId": "fan1_1",
     "MinReadingRange": 0,
     "Name": "fan1 1",
     "Reading": 7730,
     "ReadingUnits": "RPM",
     "Status": {
       "Health": "OK",
       "State": "Enabled"
     },
     "UpperThresholdCritical": 16911,
     "UpperThresholdNonCritical": 16142
   },
   {
     "@odata.id": "/redfish/v1/Chassis/chassis/Thermal#/Fans/4",
     "@odata.type": "#Thermal.v1_3_0.Fan",
     "LowerThresholdCritical": 7471,
     "LowerThresholdNonCritical": 8405,
     "MaxReadingRange": 0,
     "MemberId": "fan2_0",
     "MinReadingRange": 0,
     "Name": "fan2 0",
     "Reading": 10676,
     "ReadingUnits": "RPM",
     "Status": {
       "Health": "OK",
       "State": "Enabled"
     },
     "UpperThresholdCritical": 18356,
     "UpperThresholdNonCritical": 17522
   },
   {
     "@odata.id": "/redfish/v1/Chassis/chassis/Thermal#/Fans/5",
     "@odata.type": "#Thermal.v1_3_0.Fan",
     "LowerThresholdCritical": 5040,
     "LowerThresholdNonCritical": 5670,
     "MaxReadingRange": 0,
     "MemberId": "fan2_1",
     "MinReadingRange": 0,
     "Name": "fan2 1",
     "Reading": 7705,
     "ReadingUnits": "RPM",
     "Status": {
       "Health": "OK",
       "State": "Enabled"
     },
     "UpperThresholdCritical": 16911,
     "UpperThresholdNonCritical": 16142
   },
   {
     "@odata.id": "/redfish/v1/Chassis/chassis/Thermal#/Fans/6",
     "@odata.type": "#Thermal.v1_3_0.Fan",
     "LowerThresholdCritical": 7471,
     "LowerThresholdNonCritical": 8405,
     "MaxReadingRange": 0,
     "MemberId": "fan3_0",
     "MinReadingRange": 0,
     "Name": "fan3 0",
     "Reading": 11066,
     "ReadingUnits": "RPM",
     "Status": {
       "Health": "OK",
       "State": "Enabled"
     },
     "UpperThresholdCritical": 18356,
     "UpperThresholdNonCritical": 17522
   },
   {
     "@odata.id": "/redfish/v1/Chassis/chassis/Thermal#/Fans/7",
     "@odata.type": "#Thermal.v1_3_0.Fan",
     "LowerThresholdCritical": 5040,
     "LowerThresholdNonCritical": 5670,
     "MaxReadingRange": 0,
     "MemberId": "fan3_1",
     "MinReadingRange": 0,
     "Name": "fan3 1",
     "Reading": 7577,
     "ReadingUnits": "RPM",
     "Status": {
       "Health": "OK",
       "State": "Enabled"
     },
     "UpperThresholdCritical": 16911,
     "UpperThresholdNonCritical": 16142
   },
   {
     "@odata.id": "/redfish/v1/Chassis/chassis/Thermal#/Fans/8",
     "@odata.type": "#Thermal.v1_3_0.Fan",
     "LowerThresholdCritical": 7471,
     "LowerThresholdNonCritical": 8405,
     "MaxReadingRange": 0,
     "MemberId": "fan4_0",
     "MinReadingRange": 0,
     "Name": "fan4 0",
     "Reading": 10664,
     "ReadingUnits": "RPM",
     "Status": {
       "Health": "OK",
       "State": "Enabled"
     },
     "UpperThresholdCritical": 18356,
     "UpperThresholdNonCritical": 17522
   },
   {
     "@odata.id": "/redfish/v1/Chassis/chassis/Thermal#/Fans/9",
     "@odata.type": "#Thermal.v1_3_0.Fan",
     "LowerThresholdCritical": 5040,
     "LowerThresholdNonCritical": 5670,
     "MaxReadingRange": 0,
     "MemberId": "fan4_1",
     "MinReadingRange": 0,
     "Name": "fan4 1",
     "Reading": 7668,
     "ReadingUnits": "RPM",
     "Status": {
       "Health": "OK",
       "State": "Enabled"
     },
     "UpperThresholdCritical": 16911,
     "UpperThresholdNonCritical": 16142
   }
 ],
 "Id": "Thermal",
 "Name": "Thermal",
 "Redundancy": [],
 "Temperatures": [
   {
     "@odata.id": "/redfish/v1/Chassis/chassis/Thermal#/Temperatures/0",
     "@odata.type": "#Thermal.v1_3_0.Temperature",
     "LowerThresholdCritical": 0.0,
     "LowerThresholdNonCritical": 5.0,
     "MaxReadingRangeTemp": 0.0,
     "MemberId": "exhaust",
     "MinReadingRangeTemp": 0.0,
     "Name": "exhaust",
     "ReadingCelsius": 33.5,
     "Status": {
       "Health": "Warning",
       "State": "Enabled"
     },
     "UpperThresholdCritical": 37.0,
     "UpperThresholdNonCritical": 32.0
   },
   {
     "@odata.id": "/redfish/v1/Chassis/chassis/Thermal#/Temperatures/1",
     "@odata.type": "#Thermal.v1_3_0.Temperature",
     "LowerThresholdCritical": 0.0,
     "LowerThresholdNonCritical": 5.0,
     "MaxReadingRangeTemp": 0.0,
     "MemberId": "inlet",
     "MinReadingRangeTemp": 0.0,
     "Name": "inlet",
     "ReadingCelsius": 29.0,
     "Status": {
       "Health": "OK",
       "State": "Enabled"
     },
     "UpperThresholdCritical": 35.0,
     "UpperThresholdNonCritical": 30.0
   }
 ]
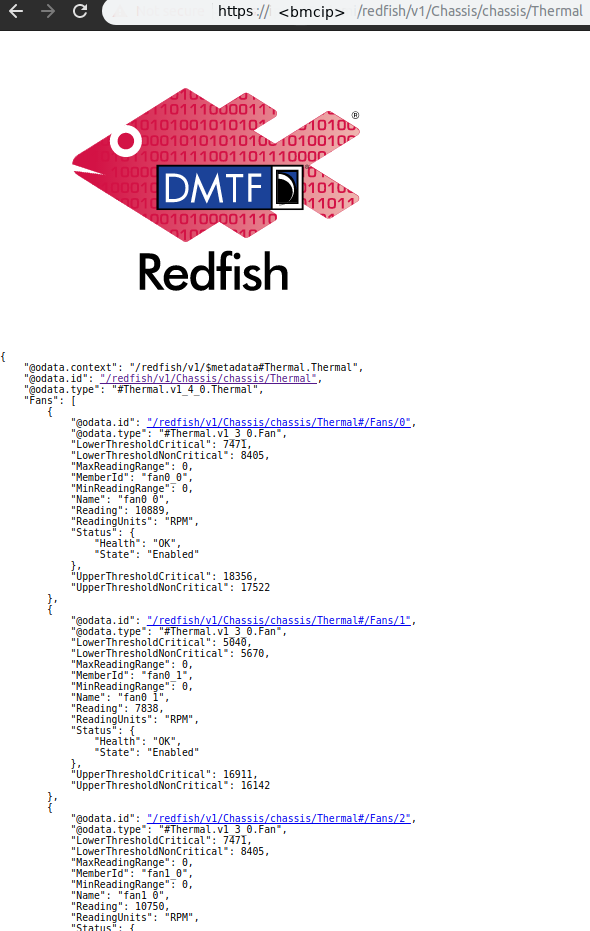
Fig. 3.2 Thermal sensor output