4. Use PopVision to profile the host code
The PopVision System Analyser is a graphical tool that displays information about the behaviour of the host-side application code. It shows an interactive view of the timeline of execution steps, helping you to identify any bottlenecks between the host servers and IPUs. Refer to the PopVision System Analyser User Guide for more information.
The PopVision Trace Instrumentation library (libpvti) provides functions to control the capture of profiling information for the host-code of your IPU application. This data can then be explored with the PopVision System Analyser. Refer to the PopVision Trace Instrumentation Library for more information.
Note
PopVision System Analyser can be downloaded from the PopVision Tools web page. There are downloads for Ubuntu, Mac and Windows.
libpvtiis included with the Poplar SDK.
4.1. Generate reports
Warning
Generating profiling reports does impact on performance:
There is an increase in compile time.
There is a small increase in code size and cycles if instrumentation is enabled.
To capture execution data from your program to a file, use the following options when executing your program. These can be specified at the same time as the POPLAR_ENGINE_OPTIONS (Section 3, Use PopVision to profile the IPU code):
PVTI_OPTIONS='{"enable":"true"}'
If the PVTI_OPTIONS environment variable is not set, no trace file is created and no events are logged.
There are other options that can be set, for example you can choose which directory you want the generated information to be saved in, and specify which channels you want to capture information from.
For more information, refer to the Capturing execution information section in the System Analyser User Guide.
4.2. Open and view reports graphically
The PopVision System Analyser displays interactive graphical and textual reports, and you can interact with these in a number of ways to get to the information you want.
You can open Local reports or Remote reports in the PopVision System Analyser as described in the section on Opening reports in the System Analyser User Guide.
Refer to the section on Viewing reports in the System Analyser User Guide for how to display specific information.
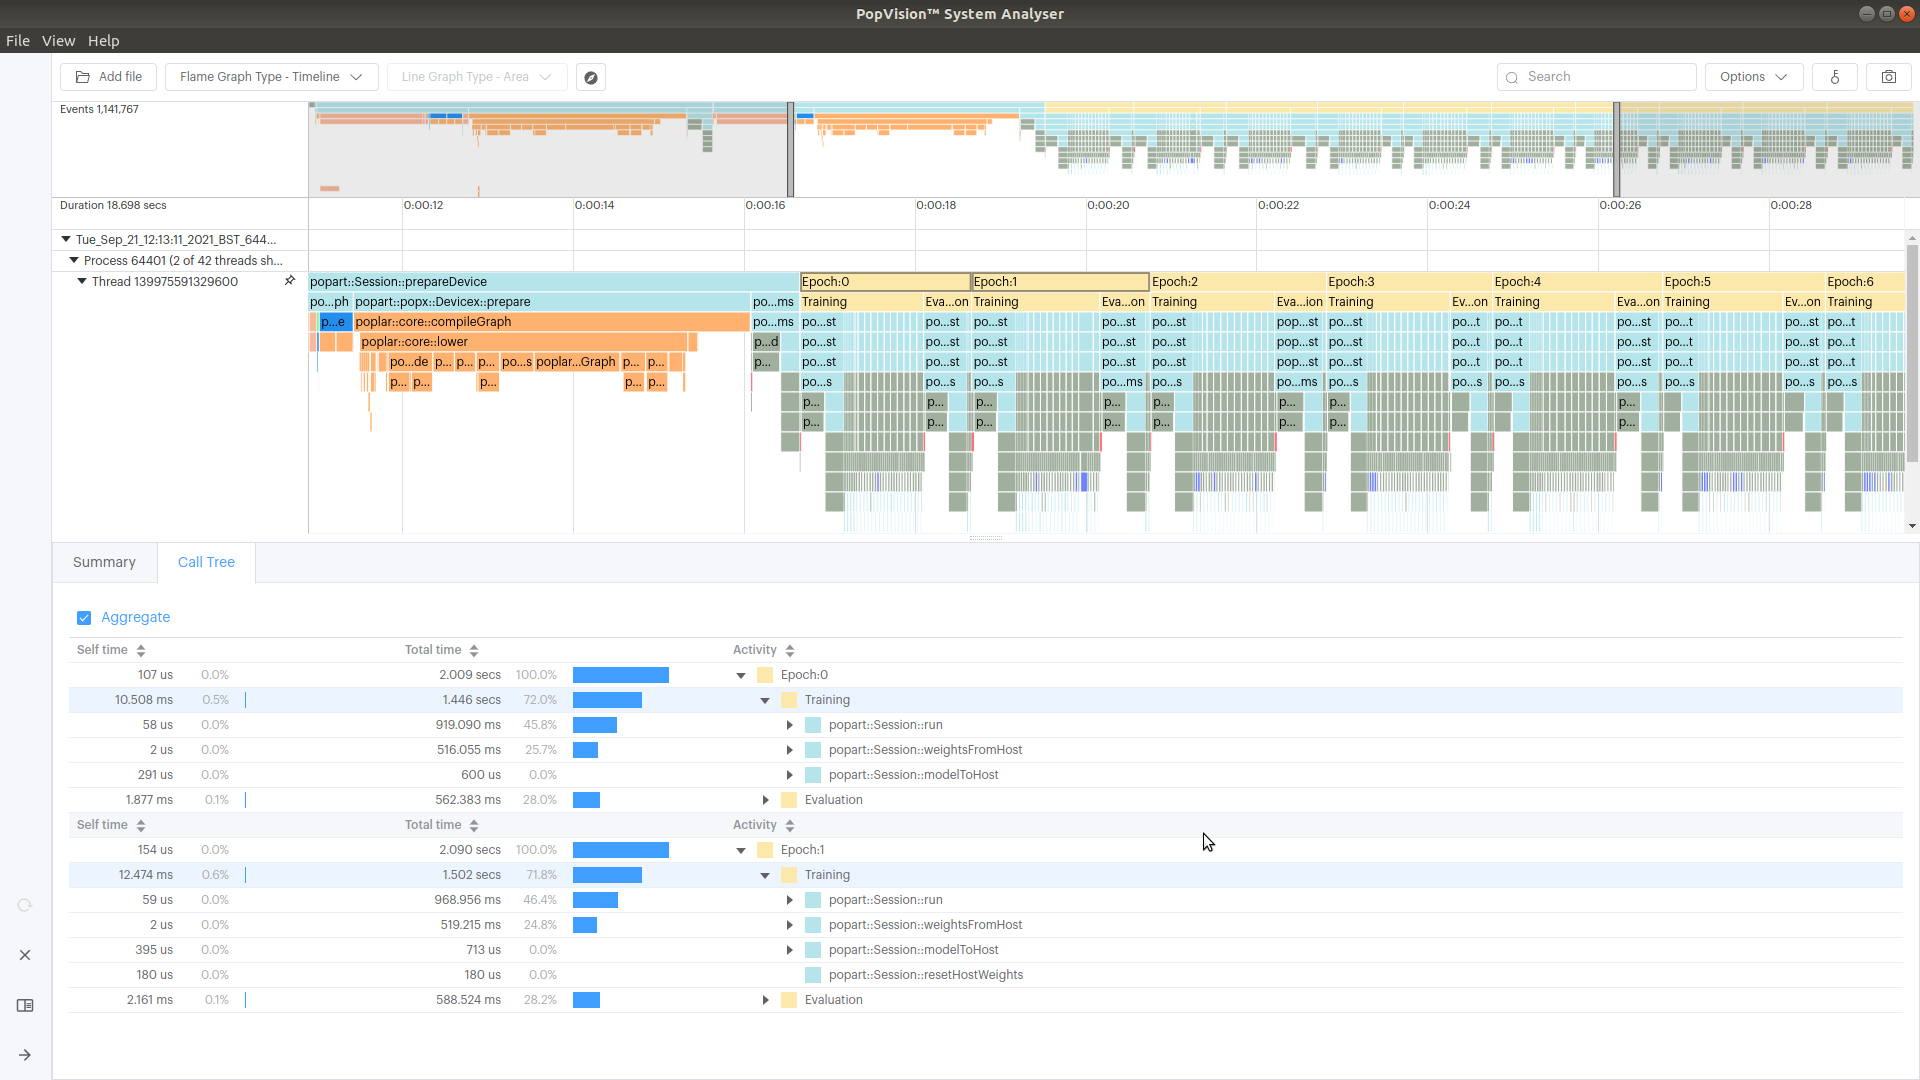
Fig. 4.1 You can select multiple blocks and compare them. This example compares Epoch 0 and Epoch 1. Information is also displayed in the Summary tab.
4.3. Control profiling programmatically
You can programmatically specify details of what to profile with libpvti, which has an API for C++ and Python. Refer to the Introduction chapter in the PopVision Trace Instrumentation Library document for more details.
The tutorial Instrumenting applications contains information about using the libpvti Python module.