3. Use PopVision to profile the IPU code
The PopVision Graph Analyser is a graphical tool that helps you to visualise how your applications are performing and utilising the IPU resources. It can display data about the graph program, memory use, and the time spent on code execution and communication. Refer to the PopVision Graph Analyser User Guide for more information.
The PopVision Analysis library (libpva) can be used for programmatic analysis of Poplar profile reports. This library provides both C++ and Python APIs that can be used to query the reports. Refer to the PopVision Analysis Library (libpva) User Guide for more information.
Note
PopVision Graph Analyser can be downloaded from the PopVision Tools web page. There are downloads for Ubuntu, Mac and Windows.
libpvais included with the Poplar SDK.
3.1. Generate reports
Warning
Generating profiling reports does impact on performance:
There is an increase in compile time.
There is a small increase in code size and cycles if instrumentation is enabled.
The PopVision Graph Analyser uses report files generated by the Poplar SDK during compilation and execution. There are different types of reports that can be generated and a full list is given in the Overview section of the Graph Analyser User Guide.
To capture a full set of reports for the PopVision Graph Analyser, you need to set the following environment variable:
POPLAR_ENGINE_OPTIONS='{"autoReport.all":"true"}'
There are other options that can be set, for example you can choose which directory you want the generated reports to be saved in, and you can include or exclude the profiling of specific information. For more information, refer to the Capturing IPU reports section in the Graph Analyser User Guide.
3.2. Open and view reports graphically
The PopVision Graph Analyser displays interactive graphical and textual reports, and you can interact with these in a number of ways to get to the information you want.
You can open Local reports or Remote reports in the PopVision Graph Analyser. Refer to the section on Opening reports in the Graph Analyser User Guide for more information.
Each report has some options that are specific to that report, but they all share some features in common, as described in the section on Viewing reports in the Graph Analyser User Guide.
For details about viewing specific reports, refer to:
3.3. View a summary report
You can view a summary of the profiling information, which may be useful for a quick overview of the resource usage and performance of your program. This summary report can be printed by the program or generated from the profile data.
You can see an example of the summary report in the Poplar and PopLibs User Guide.
3.4. View memory usage
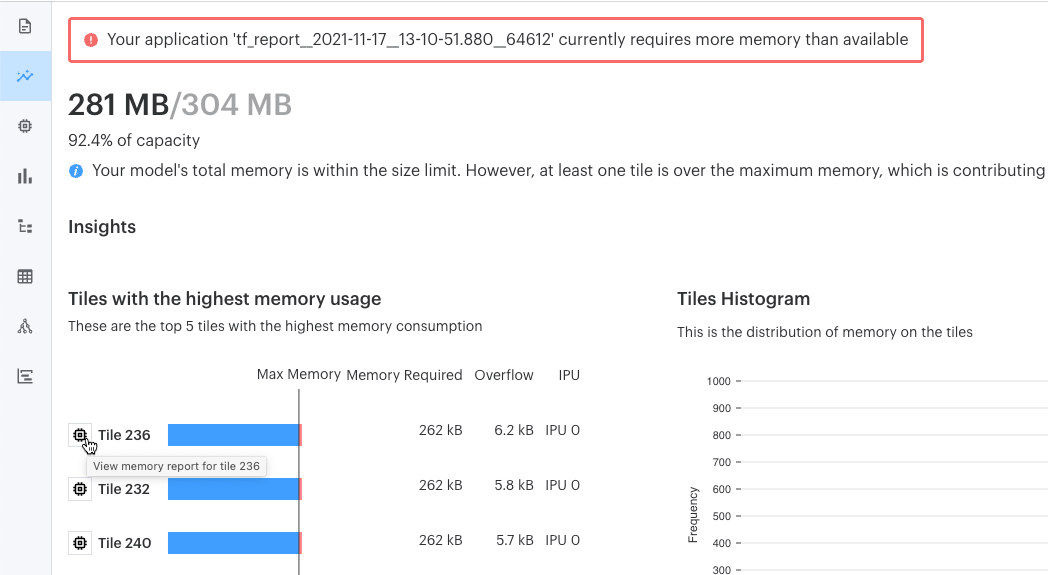
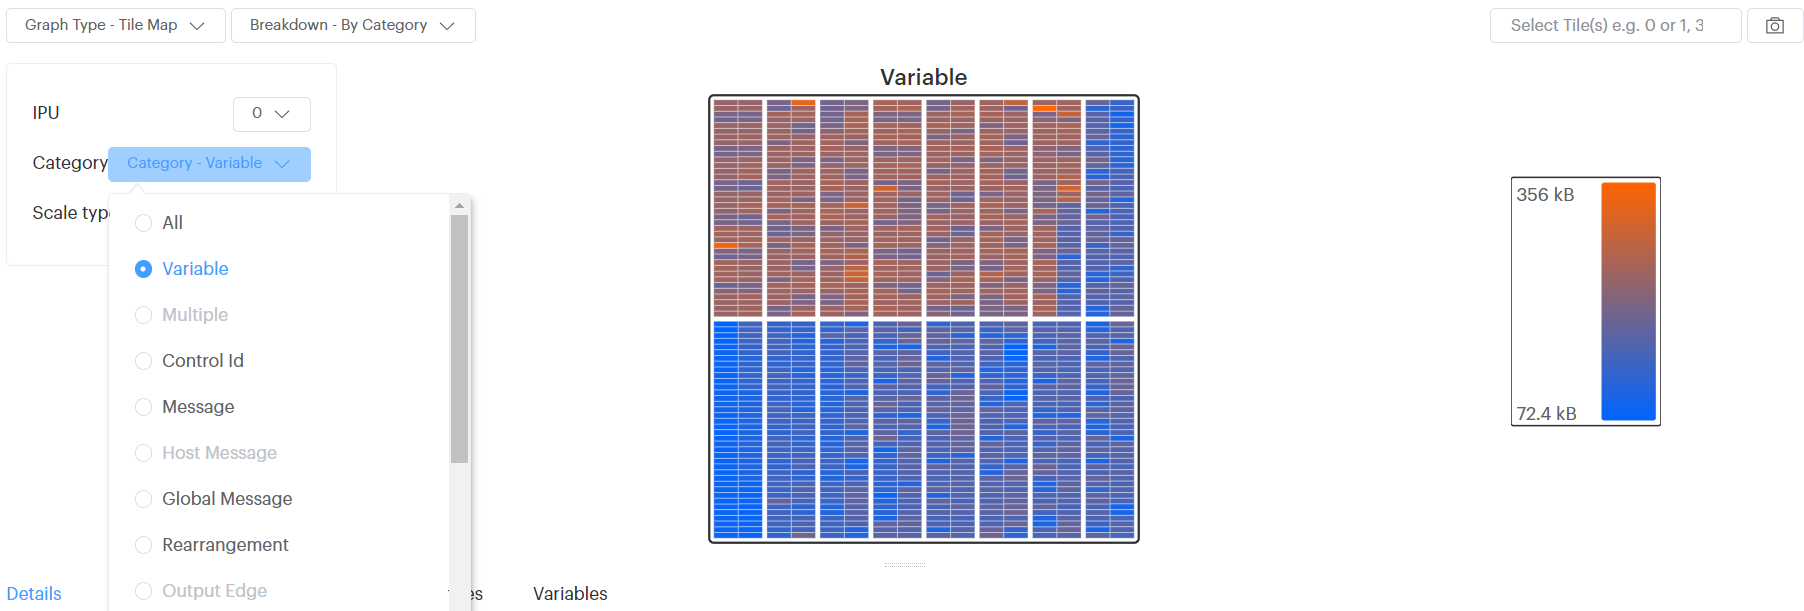
The Insights Report gives a summary of the memory usage, and suggests ways to improve things. There are many ways to use the Insights Report but one of the most common is to start with the Insights Report and then visit the tiles with the highest memory usage in the Memory Report to see which variables are responsible.
3.5. Open and view reports programmatically
You can also use libpva to analyse these reports. There is a C++ API and a Python API. Refer to PopVision Analysis Library (libpva) User Guide for more information.
The tutorial Accessing profiling information uses the Python API of libpva to access and analyse profiles from the IPU execution of a PopART MNIST example.
The tutorial Profiling output uses the C++ API of libpva to extract profiling information. This tutorial also uses the PopVision Graph Analyser to visualise the profiling reports.