7. V-IPU monitoring
V-IPU exposes critical application monitoring metrics using the OpenMetrics format. Metrics are exposed by two of the V-IPU components:
The V-IPU controller
V-IPU agents (through the V-IPU exporter component)
See Section 2, Concepts and architecture for more information on those components.
Prometheus and InfluxDB (through InfluxDB’s Telegraph product), two of the most popular open-source time-series databases, support the OpenMetrics format for metrics collection. In the following sections you can find more details about exposing metrics from the different V-IPU components, as well as an example V-IPU integration with Prometheus.
7.1. Expose monitoring metrics in V-IPU
7.1.1. V-IPU exporter
One V-IPU exporter instance runs on each IPU-Machine, and it is responsible for
exporting monitor metrics for the corresponding IPU-Machine only. The endpoint
where the metrics are exported can be found by introspecting the details of the
V-IPU agent that corresponds to a specific IPU-Machine. You can do this with
the vipu-admin get agent command (Section 9.6.1, Get info for an agent) and look
for the “Exporter” line in the output.
A sample output of the vipu-admin get agent for an agent
named “ag10” (corresponding to the 10th IPU-Machine in an IPU-POD64) is
shown below.
$ vipu-admin get agent ag10
-----------------------------------------------------------------
 Agent ID             | ag10
 Host                 | 10.1.2.10
 Port                 | 8080
 Status               | Up
 Exporter             | http://10.1.2.10:2112/metrics
 Platform             | ipum-p2
 Manufacturer         | Graphcore
 Discovery Mode       | DM_GCDA
 Virm version         | master-1189-1493e2a
 Runtime version      | 1.0.48
 Board serial number  | 8203921-0007
 Part number          | GC-ADA2-00-ES1 Rev. C
 GWSW Version         | 2.0.5
 IPUoF server version | v1.3.3
 HDF Version          | 1.0.1
 HDF Hash             | 1275acb46311f7a46e05f721d73d180c44975e7e
 Num of IPUs          | 4
------------------------------------------------------------------------------------------------------
 IPU         | PCI          | Device | Firmware | Architecture | Num Tiles | Silicon ID
------------------------------------------------------------------------------------------------------
 0           | 0004:01:00.0 | 0      | 2.0.7    | 2 (ipu2)     | 1472      | TAAX82.13.4.9.CC39.3088
 1           | 0003:01:00.0 | 1      | 2.0.7    | 2 (ipu2)     | 1472      | TAAX82.14.3.9.CC39.3268
 2           | 0002:01:00.0 | 2      | 2.0.7    | 2 (ipu2)     | 1472      | TAAX82.25.5.5.CC39.2728
 3           | 0001:01:00.0 | 3      | 2.0.7    | 2 (ipu2)     | 1472      | TAAX82.25.6.10.CC39.2908
In the example command output above, notice that the V-IPU exporter for the particular IPU-Machine is exporting metrics from “http://10.1.2.10:2112/metrics”. If you point your browser or a utility to that URL, you can see all the current values of the metrics that are exported for the corresponding IPU-Machine. For example:
$ curl -s http://10.1.2.10:2112/metrics
# HELP chassis_fan fan speed in RPMS
# TYPE chassis_fan gauge
chassis_fan{fan_id="0_0"} 8716
chassis_fan{fan_id="0_1"} 7677
...
chassis_fan{fan_id="4_0"} 8711
chassis_fan{fan_id="4_1"} 7636
# HELP chassis_power power measurement in Watts
# TYPE chassis_power gauge
chassis_power 310
chassis_power{power_direction="input",psu_id="ps0"} 122
chassis_power{power_direction="input",psu_id="ps1"} 186
chassis_power{power_direction="output",psu_id="ps0"} 82
chassis_power{power_direction="output",psu_id="ps1"} 92
# HELP chassis_temperature temperature measured in DegreesC
# TYPE chassis_temperature gauge
chassis_temperature{temp_sensor_id="exhaust_temp"} 43
chassis_temperature{temp_sensor_id="gw_core_temp"} 64
chassis_temperature{temp_sensor_id="inlet_temp"} 33.5
...
chassis_temperature{psu_id="ps1",temp_sensor_id="inlet"} 39
chassis_temperature{psu_id="ps1",temp_sensor_id="outlet"} 51
# HELP exporter_ticks A tick counter that increases every time the exporter is accessed
# TYPE exporter_ticks counter
exporter_ticks 3100
# HELP gcipuinfo_clock_frequency Current clock frequency
# TYPE gcipuinfo_clock_frequency gauge
gcipuinfo_clock_frequency{device_id="0"} 1330
gcipuinfo_clock_frequency{device_id="1"} 1330
gcipuinfo_clock_frequency{device_id="2"} 1330
gcipuinfo_clock_frequency{device_id="3"} 1330
# HELP gcipuinfo_parity_error_count_threshold Threshold number of parity errors to promote to a unrecoverable error
# TYPE gcipuinfo_parity_error_count_threshold gauge
gcipuinfo_parity_error_count_threshold{device_id="0"} 2
gcipuinfo_parity_error_count_threshold{device_id="1"} 2
gcipuinfo_parity_error_count_threshold{device_id="2"} 2
gcipuinfo_parity_error_count_threshold{device_id="3"} 2
# HELP gcipuinfo_parity_error_interval_threshold Threshold in seconds at which `num parity errors` are promoted to an uncorrectable error
# TYPE gcipuinfo_parity_error_interval_threshold gauge
gcipuinfo_parity_error_interval_threshold{device_id="0"} 3600
gcipuinfo_parity_error_interval_threshold{device_id="1"} 3600
gcipuinfo_parity_error_interval_threshold{device_id="2"} 3600
gcipuinfo_parity_error_interval_threshold{device_id="3"} 3600
# HELP gw_link_pkt_drop_count Number of dropped packets
# TYPE gw_link_pkt_drop_count counter
gw_link_pkt_drop_count{gwlink="L0", origin="devmem"} 0
gw_link_pkt_drop_count{gwlink="L1", origin="devmem"} 0
# HELP gw_link_rx_ack_count Number of ACKs received
# TYPE gw_link_rx_ack_count counter
gw_link_rx_ack_count{gwlink="L0", origin="driver"} 0
gw_link_rx_ack_count{gwlink="L1", origin="driver"} 0
# HELP gw_link_rx_good_packets_count Number of good packets received
# TYPE gw_link_rx_good_packets_count counter
gw_link_rx_good_packets_count{gwlink="L0", origin="devmem"} 0
gw_link_rx_good_packets_count{gwlink="L1", origin="devmem"} 0
# HELP gw_link_rx_nack_count Number of NACKs received
# TYPE gw_link_rx_nack_count counter
gw_link_rx_nack_count{gwlink="L0", origin="devmem"} 0
gw_link_rx_nack_count{gwlink="L1", origin="devmem"} 0
# HELP gw_link_rx_total_bytes_count Number of total bytes received
# TYPE gw_link_rx_total_bytes_count counter
gw_link_rx_total_bytes_count{gwlink="L0", origin="driver"} 0
gw_link_rx_total_bytes_count{gwlink="L1", origin="driver"} 0
# HELP gw_link_rx_total_packets_count Number of total packets received
# TYPE gw_link_rx_total_packets_count counter
gw_link_rx_total_packets_count{gwlink="L0", origin="driver"} 0
gw_link_rx_total_packets_count{gwlink="L1", origin="driver"} 0
# HELP gw_link_tx_total_packets_count Number of total packets transmitted
# TYPE gw_link_tx_total_packets_count counter
gw_link_tx_total_packets_count{gwlink="L0", origin="driver"} 0
gw_link_tx_total_packets_count{gwlink="L1", origin="driver"} 0
# HELP ipu_attached Whether or not an application process is attached to the device (1 = attached).
# TYPE ipu_attached gauge
ipu_attached{device_id="0"} 0
ipu_attached{device_id="1"} 0
ipu_attached{device_id="2"} 0
ipu_attached{device_id="3"} 0
# HELP ipu_link_err_cnt IPU Link error counter
# TYPE ipu_link_err_cnt counter
ipu_link_err_cnt{device_id="0",ipu_link="0B"} 0
ipu_link_err_cnt{device_id="0",ipu_link="0C"} 0
...
ipu_link_err_cnt{device_id="3",ipu_link="3B"} 0
ipu_link_err_cnt{device_id="3",ipu_link="3C"} 0
# HELP ipu_tile_clk_speed The frequency which the tiles are currently running (MHz).
# TYPE ipu_tile_clk_speed gauge
ipu_tile_clk_speed{device_id="0"} 1330
ipu_tile_clk_speed{device_id="1"} 1330
ipu_tile_clk_speed{device_id="2"} 1330
ipu_tile_clk_speed{device_id="3"} 1330
# HELP ipum_hardware_info Information about the IPUM hardware
# TYPE ipum_hardware_info gauge
ipum_hardware_info{board_serial_number="8203921-0007",part_number="GC-ADA2-00-ES1 Rev. C",platform="ipum-p2"} 1
7.1.2. V-IPU exporter metrics description
In this section you can find a description of all the metrics exported by the V-IPU exporter.
Metric name |
Description |
|---|---|
|
Fan speed in RPMS |
|
Power measurement in watts |
|
Temperature measured in Degrees Celsius |
|
A tick counter that increases every time the exporter is accessed |
|
IPU clock frequency (in MHz) |
|
Threshold for number of parity errors before an uncorrectable error is promoted |
|
Interval for gcipuinfo_parity_error_count_threshold (in seconds) |
|
Number of dropped packets |
|
Number of ACKs received |
|
Number of good packets received |
|
Number of NACKs received |
|
Number of total bytes received |
|
Number of total packets received |
|
Number of total packets transmitted |
|
Indicates whether or not an application process is attached to the device (1 = attached) |
|
IPU Link error counter |
|
The frequency which the tiles are currently running (MHz). |
|
Information about the IPU-Machine hardware |
7.2. V-IPU controller
The V-IPU controller has its own built-in exporter that exports metrics for the
V-IPU management system. The built-in exporter is disabled by default, but you
can enable it by passing the --exporter-activate option to
the vipu-server command as explained in Section 9.1, Global options.
When it is enabled, you can see the currently exported metrics by pointing your
web browser to the IP address of the machine where the V-IPU controller
(vipu-server) is running. The default port used by the built-in exporter is
2113, but this can be changed if needed (see Section 9.1, Global options for
more details).
$ curl -s http://vipu-controller:2113/metrics
# HELP exporter_ticks A tick counter that increases every time the exporter is accessed
# TYPE exporter_ticks counter
exporter_ticks 1206
# HELP grpc_agent_latency_hist Communication latency between the VIPU server and VIRM agents, measured in microseconds
# TYPE grpc_agent_latency_hist histogram
grpc_agent_latency_hist_bucket{agent="ag09",endpoint="InfoService/GetInfo",status="success",le="1000"} 24
grpc_agent_latency_hist_bucket{agent="ag09",endpoint="InfoService/GetInfo",status="success",le="2000"} 32
grpc_agent_latency_hist_bucket{agent="ag09",endpoint="InfoService/GetInfo",status="success",le="5000"} 33
grpc_agent_latency_hist_bucket{agent="ag09",endpoint="InfoService/GetInfo",status="success",le="10000"} 33
grpc_agent_latency_hist_bucket{agent="ag09",endpoint="InfoService/GetInfo",status="success",le="20000"} 33
grpc_agent_latency_hist_bucket{agent="ag09",endpoint="InfoService/GetInfo",status="success",le="50000"} 33
grpc_agent_latency_hist_bucket{agent="ag09",endpoint="InfoService/GetInfo",status="success",le="100000"} 33
grpc_agent_latency_hist_bucket{agent="ag09",endpoint="InfoService/GetInfo",status="success",le="200000"} 33
grpc_agent_latency_hist_bucket{agent="ag09",endpoint="InfoService/GetInfo",status="success",le="500000"} 33
grpc_agent_latency_hist_bucket{agent="ag09",endpoint="InfoService/GetInfo",status="success",le="1e+06"} 33
grpc_agent_latency_hist_bucket{agent="ag09",endpoint="InfoService/GetInfo",status="success",le="2e+06"} 33
grpc_agent_latency_hist_bucket{agent="ag09",endpoint="InfoService/GetInfo",status="success",le="5e+06"} 33
grpc_agent_latency_hist_bucket{agent="ag09",endpoint="InfoService/GetInfo",status="success",le="1e+07"} 33
grpc_agent_latency_hist_bucket{agent="ag09",endpoint="InfoService/GetInfo",status="success",le="+Inf"} 33
grpc_agent_latency_hist_sum{agent="ag09",endpoint="InfoService/GetInfo",status="success"} 34355
grpc_agent_latency_hist_count{agent="ag09",endpoint="InfoService/GetInfo",status="success"} 33
grpc_agent_latency_hist_bucket{agent="ag09",endpoint="VersionService/GetVersion",status="success",le="1000"} 6
grpc_agent_latency_hist_bucket{agent="ag09",endpoint="VersionService/GetVersion",status="success",le="2000"} 33
grpc_agent_latency_hist_bucket{agent="ag09",endpoint="VersionService/GetVersion",status="success",le="5000"} 33
grpc_agent_latency_hist_bucket{agent="ag09",endpoint="VersionService/GetVersion",status="success",le="10000"} 33
grpc_agent_latency_hist_bucket{agent="ag09",endpoint="VersionService/GetVersion",status="success",le="20000"} 33
grpc_agent_latency_hist_bucket{agent="ag09",endpoint="VersionService/GetVersion",status="success",le="50000"} 33
grpc_agent_latency_hist_bucket{agent="ag09",endpoint="VersionService/GetVersion",status="success",le="100000"} 33
grpc_agent_latency_hist_bucket{agent="ag09",endpoint="VersionService/GetVersion",status="success",le="200000"} 33
grpc_agent_latency_hist_bucket{agent="ag09",endpoint="VersionService/GetVersion",status="success",le="500000"} 33
grpc_agent_latency_hist_bucket{agent="ag09",endpoint="VersionService/GetVersion",status="success",le="1e+06"} 33
grpc_agent_latency_hist_bucket{agent="ag09",endpoint="VersionService/GetVersion",status="success",le="2e+06"} 33
grpc_agent_latency_hist_bucket{agent="ag09",endpoint="VersionService/GetVersion",status="success",le="5e+06"} 33
grpc_agent_latency_hist_bucket{agent="ag09",endpoint="VersionService/GetVersion",status="success",le="1e+07"} 33
grpc_agent_latency_hist_bucket{agent="ag09",endpoint="VersionService/GetVersion",status="success",le="+Inf"} 33
grpc_agent_latency_hist_sum{agent="ag09",endpoint="VersionService/GetVersion",status="success"} 39300
grpc_agent_latency_hist_count{agent="ag09",endpoint="VersionService/GetVersion",status="success"} 33
# HELP vipu_num_agents Number of agents currently managed by the VIPU server
# TYPE vipu_num_agents gauge
vipu_num_agents 16
# HELP vipu_num_clusters Number of clusters currently active
# TYPE vipu_num_clusters gauge
vipu_num_clusters 1
# HELP vipu_num_partitions Number of partitions currently active
# TYPE vipu_num_partitions gauge
vipu_num_partitions 1
Metric name |
Description |
|---|---|
|
A tick counter that increases every time the exporter is accessed |
|
Provides a histogram of the communication latency per API-endpoint between the V-IPU server and V-IPU agents, measured in microseconds. Note this is not the latency of the user facing APIs, but the internal communication latency between the V-IPU controller and the V-IPU agent |
|
Number of V-IPU agents currently managed by the VIPU server |
|
Number of clusters currently active |
|
Number of partitions currently active |
7.3. Example V-IPU / Prometheus integration
This section assumes that you are familiar with Prometheus. The scope is to provide a simple example integration where Prometheus scrapes and stores metrics from a V-IPU system. The metrics can then be visualised with an observability platform of your choice, like Grafana. For more information about Prometheus, including the Prometheus configuration file and query language (PromQL), consult the Prometheus documentation.
7.3.1. Prometheus configuration
In the following Prometheus configuration sample file make sure you
change the line - 'vipu-server:2113' to point to the address:port
where the built-in exporter of your V-IPU controller is running. Also
make sure that the directory /prometheus-config is readable by
the prometheus process, and writable by the vipu-server process.
We’ll need this in the next steps.
---
global:
  # Scrape all targets for metrics every 10 seconds
  scrape_interval: 10s

scrape_configs:
  - job_name: vipu-agent-exporters
    file_sd_configs:
      - files:
          # File containing the list of vipu-exporters to scrape
          - /prometheus-config/vipu-agent-exporter-targets.json
    relabel_configs:
      # Reading hosts that look like this: host:port/metrics-path
      # and changes the __metrics_path__ to /metric-path
      # and the __address__ to host:port.
      # Introducing a new host label as well.
      - source_labels: [__address__]
        regex: '.+(/.*)$'               # capture '/...' part
        target_label: __metrics_path__  # change metrics path
      - source_labels: [__address__]
        regex: '(^.+)/.*'               # capture host:port
        target_label: __address__       # change target
      - source_labels: [__address__]
        regex: '(.+):.*'                # capture host
        target_label: host              # add a new host label
  - job_name: vipu-exporter
    static_configs:
      - targets:
          # scrape the vipu-server
          - 'vipu-server:2113'
          # scrape prometheus server itself
          - 'localhost:2113'
Download: prometheus.yml
Save the above configuration file to a file
named prometheus.yml and start the Prometheus service with the
following command. This will instruct Prometheus to load the
configuration file we just created and store the metrics in the DB for
15 days (15d).
$ Prometheus \
        --config.file=prometheus.yml \
        --storage.tsdb.retention.time=15d
Open your browser and check the Prometheus targets that are getting scraped by Prometheus at this point. There should be two targets:
The V-IPU controller
The Prometheus instance itself
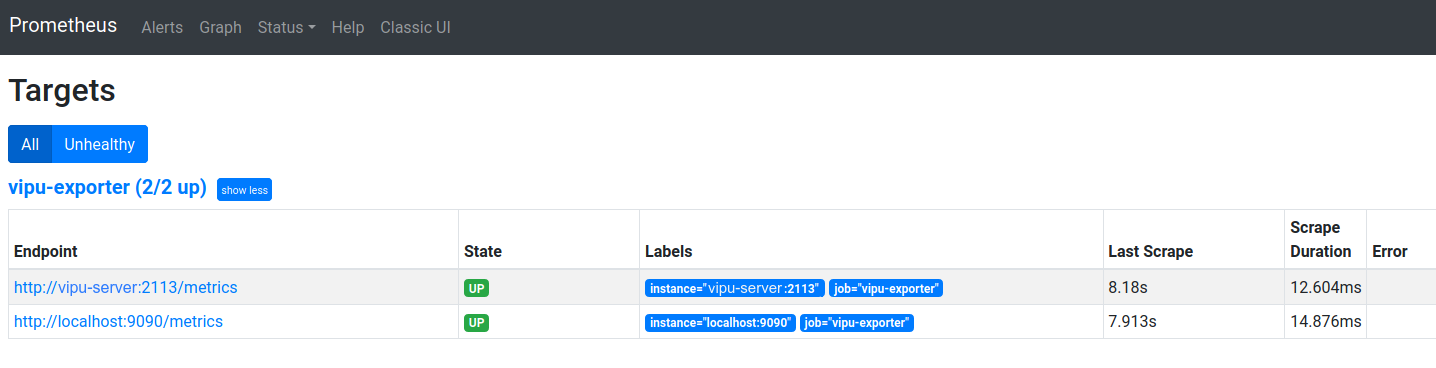
Fig. 7.1 Graphical user interface
We are still not scraping metrics from any IPU-Machines. We will now do that by
manually adding the IPU-Machine entries that we want to be scraped by Prometheus
into the /prometheus-config/vipu-agent-exporter-targets.json file that we defined
in the prometheus.yml configuration file above. To find the V-IPU exporter
endpoint that Prometheus will scrape, read the section Section 7.1.1, V-IPU exporter.
Add one or more entries in the format shown by the example below and save the file
as /prometheus-config/vipu-agent-exporter-targets.json.
[
  {
    "targets": [
      "10.1.2.9:2112/metrics"
    ],
    "labels": {
      "agent_id": "ag09"
    }
  },
  {
    "targets": [
      "10.1.2.10:2112/metrics"
    ],
    "labels": {
      "agent_id": "ag10"
    }
  }
]
Note that after you save the file /prometheus-config/vipu-agent-exporter-targets.json,
you don’t need to restart Prometheus. Prometheus will monitor this file for
changes and try to scrape any new targets that are added or removed. If you
check the Prometheus targets now, you should see four targets that are getting
scraped:
The V-IPU controller
The Prometheus instance itself
The V-IPU exporter from the IPU-Machine 10.1.2.9
The V-IPU exporter from the IPU-Machine 10.1.2.10
One important thing to remember at this point is that Prometheus will always try to make direct contact with the scrape targets. That means that Prometheus should have direct access to the IPU-Machines 10.1.2.9 and 10.1.2.10 that were added in this example.
7.3.2. V-IPU controller / Prometheus integration
The V-IPU controller supports auto-generating
the /prometheus-config/vipu-agent-exporter-targets.json file that we edited
manually in the Prometheus
Configuration section.
If you start vipu-server with the
option --prometheus-sd-config-file=/prometheus-config/vipu-agent-exporter-targets.json,
the V-IPU controller will automatically update the corresponding configuration
file when agents are created or removed with the vipu-admin create agent or
vipu-admin remove agent commands. Then the Prometheus server will pick up and
start scraping new IPU-Machines that are added in the V-IPU management system,
or forget decommissioned ones that are removed. If the Prometheus server is
running in a different machine than the one where the V-IPU controller is
running, the --prometheus-sd-config-file must be shared over a network
file system.
$ vipu-server --exporter-activate \
     --prometheus-sd-config-file=/prometheus-config/vipu-agent-exporter-targets.json
7.3.3. Using Grafana for visualization
Promethus supports using Grafana for creating dashboards for visualization, described in https://prometheus.io/docs/visualization/grafana/