7. Monitoring and alerts
7.1. Monitoring
Prometheus is used for monitoring the vPOD infrastructure and is presented in a Grafana instance for each vPOD. Prometheus is then federated from multiple vPODs into a Prometheus collector and Grafana instance for whole-cloud monitoring.
Prometheus exporters are installed and federated as follows:
Prometheus in the OpenStack infrastructure is enabled through Kayobe which automatically deploys a containerised HA instance of Prometheus/Grafana across the control plane hosts.
Each hypervisor has a containerised node-exporter instance providing monitoring of each hypervisor. This is also deployed through Kayobe.
Every VM instance which uses a provided OS image contains an OS-standard node-exporter.
On each vPOD:
IPU metrics are served via the IPU-Gateway interface and gathered from
http://<IPU-Machine IPU-Gateway IP>:2112/metrics.The Poplar VMs use node-exporter.
Control VMs federate Poplar VM data with IPU-Machine data together on a single Prometheus instance.
A single vpod-management VM is created which federates all vPOD Prometheus data together.
Ceph clusters (where deployed) have a built-in Prometheus exporter.
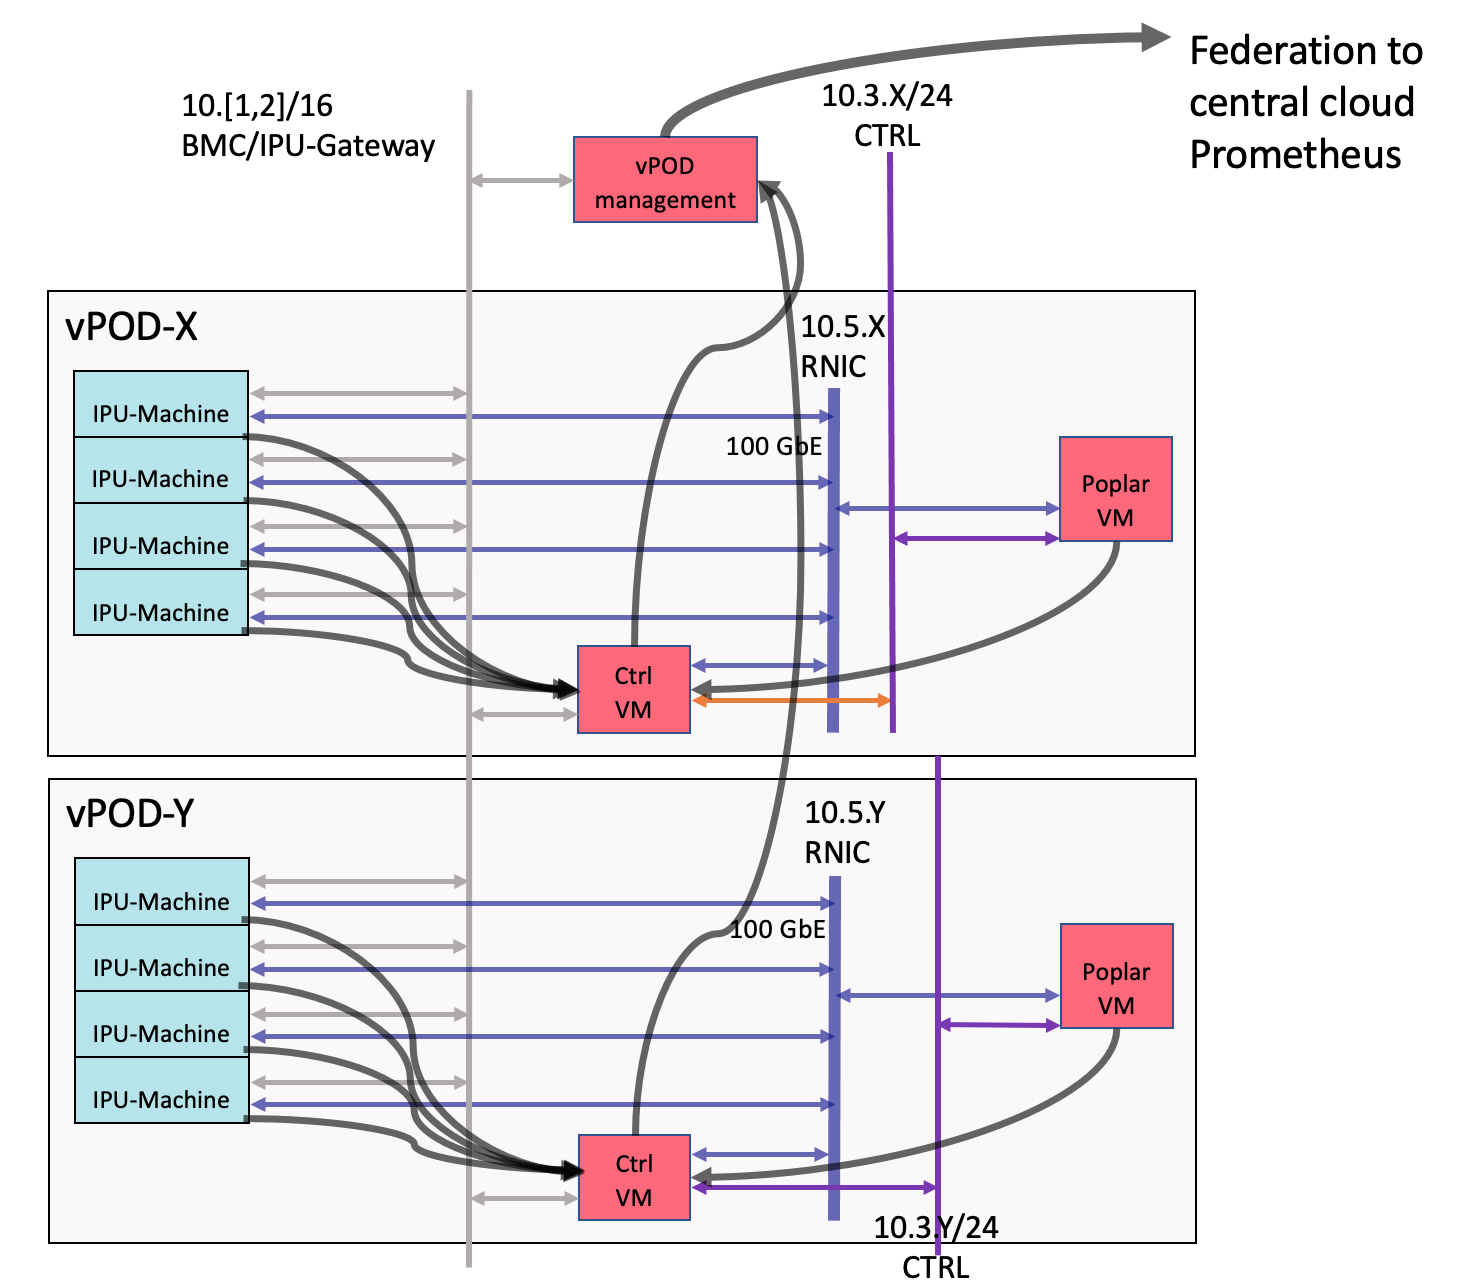
Fig. 7.1 Monitoring with Prometheus
7.2. Alerting
Alerts for critical and upcoming issues are configured in the federated Prometheus monitoring and can be sent to email, slack, and so on.
7.2.1. Log aggregation
Each control VM (within each vPOD) aggregates the syslog from each IPU-Machine in the vPOD.
Each IPU-Machine BMC is configured to deliver
syslogusingrsyslogdconfiguration.The IPU-Gateway in each IPU-Machine is configured to deliver
syslogusingrsyslogdconfiguration.
The rack_tool application is used to set up both these configurations either during or after IPU-Machine software updates.
The syslogs from all hypervisors and VMs (including aggregated vPODs) are collected by a central log analysis service (for example Elastic Stack) to allow for deep-log checking, trend analysis and alerting.