Source (GitHub) | Download notebook
7.1. PopVision Tutorial: Accessing profiling information
In this tutorial you will learn to use the libpva Python module, this library
is used to analyse profiles of the programs that run on the IPU. It provides
granular information on the compute and memory exchange steps taken on each
tile of the IPU. You will learn to:
Use the
libpvalibrary to access and analyse profiles from the IPU execution.
How to run this tutorial
To run the Jupyter notebook version of this tutorial:
Enable a Poplar SDK environment (see the Getting Started guide for your IPU system)
In the same environment, install the Jupyter notebook server:
python -m pip install jupyterLaunch a Jupyter Server on a specific port:
jupyter-notebook --no-browser --port <port number>Connect via SSH to your remote machine, forwarding your chosen port:
ssh -NL <port number>:localhost:<port number> <your username>@<remote machine>
For more details about this process, or if you need troubleshooting, see our guide on using IPUs from Jupyter notebooks.
Setup
%pip install -r requirements.txt
For this tutorial we are going to use a PopTorch MNIST example and capture profile information that can be read using the PopVision Analysis Library, which is included in the Poplar SDK package. The PopTorch MNIST example is from the simple_applications/pytorch/mnist directory).
We will run the MNIST example with profiling enabled:
import os
import subprocess
import pva
import matplotlib
import matplotlib.pyplot as plt
from pathlib import Path
mnist_path = "../../../simple_applications/pytorch/mnist/mnist_poptorch.py"
os.environ[
    "POPLAR_ENGINE_OPTIONS"
] = '{"autoReport.all":"true", "autoReport.directory":"mydirectory"}'
subprocess.run(["python3", mnist_path])
CompletedProcess(args=['python3', '../../../simple_applications/pytorch/mnist/mnist_poptorch.py'], returncode=0)
When this has completed you will find a file called profile.pop in the training and inference subdirectories of the current working directory.
During the execution of these commands, inference/profile.pop and
training/profile.pop files were generated. These files report the number of
cycles spent on each operation by each tile of the IPU. This rich profiling
information can be analysed both using the libpva Python library included in
the Poplar SDK which can be downloaded from our
Graphcore downloads portal and the PopVision Graph Analyser which can be
found on our developer page
Using the Python API
In this tutorial we use the libpva library to access profiles of the IPU, the
documentation for it can be found here:
PopVision Analysis Python API.
Loading a profile
Start Python in the directory that contains the profile.pop file you would like to read. Loading the profile into a Python object is easily done with the following:
# Grab the most recently modified profile.pop file
working_dir = Path(".").glob("./mydirectory/training/*.pop")
report_files = [f for f in working_dir if f.is_file()]
report_files.sort(reverse=True, key=lambda a: a.stat().st_mtime)
report_path = str(report_files[0])

# Open the file

report = pva.openReport(report_path)
Now you can access information from the report, as shown in the following examples:
print("Number of compute sets: ", report.compilation.graph.numComputeSets)
print("Number of tiles on target: ", report.compilation.target.numTiles)
print("Version of Poplar used: ", report.poplarVersion.string)
Number of compute sets:  181
Number of tiles on target:  1472
Version of Poplar used:  3.1.0 (a027fa0bd5)
You can also iterate over properties such as execution steps, which each represent the execution of a program in Poplar. In this example, we sum the total number of cycles on IPU 0 for all execution steps:
sum(step.ipus[0].cycles for step in report.execution.steps)
1349607088
Using visitors to explore the data
To analyse the compiled program, it is best to use a ProgramVisitor class with
the appropriate visitor functions (See API
Documentation
for a list of available methods).
A more general explanation of the “visitor pattern” is available on wikipedia along with a Python example.
For example, the following class will print the name of any OnTileExecute
programs that use multiple vertices:
class TestVisitor(pva.ProgramVisitor):
    def visitOnTileExecute(self, onTileExecute):
        if len(onTileExecute.computeset.vertices) > 1:
            print(onTileExecute.name)
Now we will apply this visitor to every program so that we can see a list of
all OnTileExecute programs executed that use multiple vertices:
v = TestVisitor()
for s in report.execution.steps:
    s.program.accept(v)
NOTE: You may see a long list of identical names. This is due to multiple OnTileExecute steps having the same name, which is to be expected.
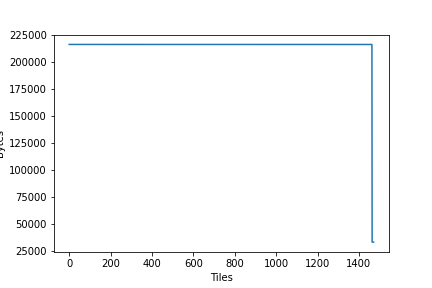
You can easily create plots of information using Python’s matplotlib library. The following example plots total memory use (including gaps) for each tile.
matplotlib.use("Agg")

plt.plot([tile.memory.total.includingGaps for tile in report.compilation.tiles])
plt.xlabel("Tiles")
plt.ylabel("Bytes")
plt.savefig("MemoryByTilePlot.png")
Now open the newly created MemoryByTilePlot.png file and you should see a
plot similar to the following.
Going further with the PopVision Graph Analyser
The profiles (*.pop files) generated during this tutorial can also be opened
using the PopVision Graph Analyser desktop tool, it provides a graphical
interface to explore the performance of your programs on the IPU and can enable
you to optimize the use of tile resources in your IPU application.
The Poplar profiling tutorial provides a comprehensive example of using the Graph Analyser to profile a simple IPU application.
You can also find videos introducing many of the features of the Poplar SDK and the PopVision analysis tools by watching Graphcore’s introductory videos.
Generated:2022-10-20T15:07 Source:walkthrough.py SDK:3.1.0-EA.1+1166 SST:0.0.9